Fig. 1
Download original image
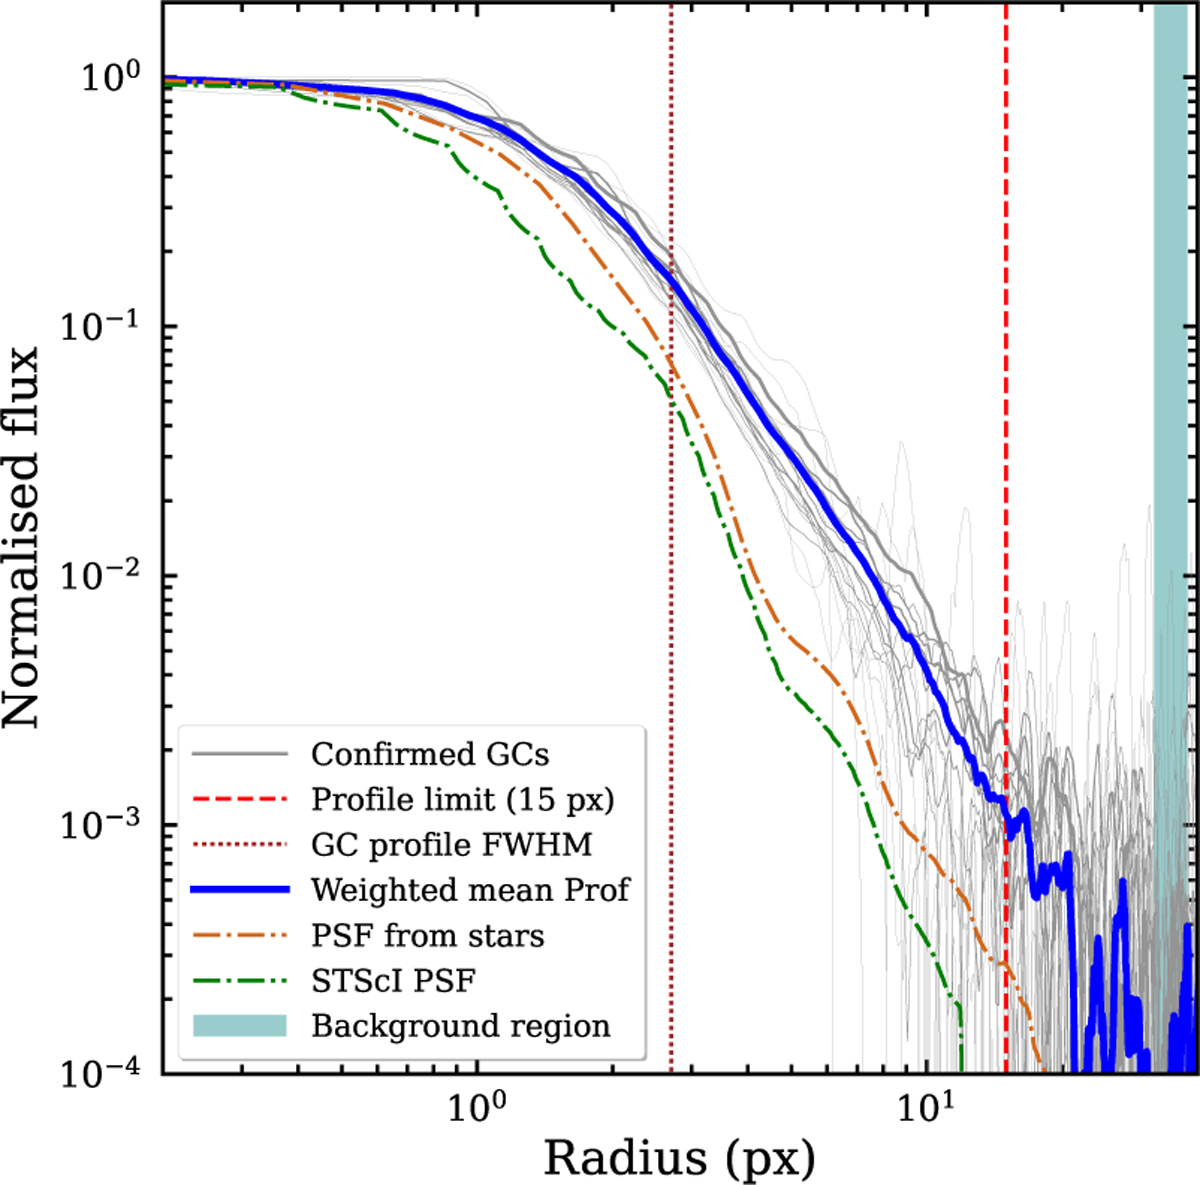
GC radial profiles in the WFC3/F606W band for the 20 spectroscopically confirmed GCs (grey). The blue line shows the S/N weighted mean profile of the GCs. We also plot the profile of the empirical PSF provided by the STScI in green, and the profile of the PSF obtained directly from stars of the images in orange. The vertical dashed red line (0.″6, equivalent to 15 px in WFC3 imaging) indicates where the profile is truncated, the vertical dotted brown line shows the FWHM of the mean GC profile, and the light blue region indicates where the background has been estimated.
Current usage metrics show cumulative count of Article Views (full-text article views including HTML views, PDF and ePub downloads, according to the available data) and Abstracts Views on Vision4Press platform.
Data correspond to usage on the plateform after 2015. The current usage metrics is available 48-96 hours after online publication and is updated daily on week days.
Initial download of the metrics may take a while.