Fig. 10
Download original image
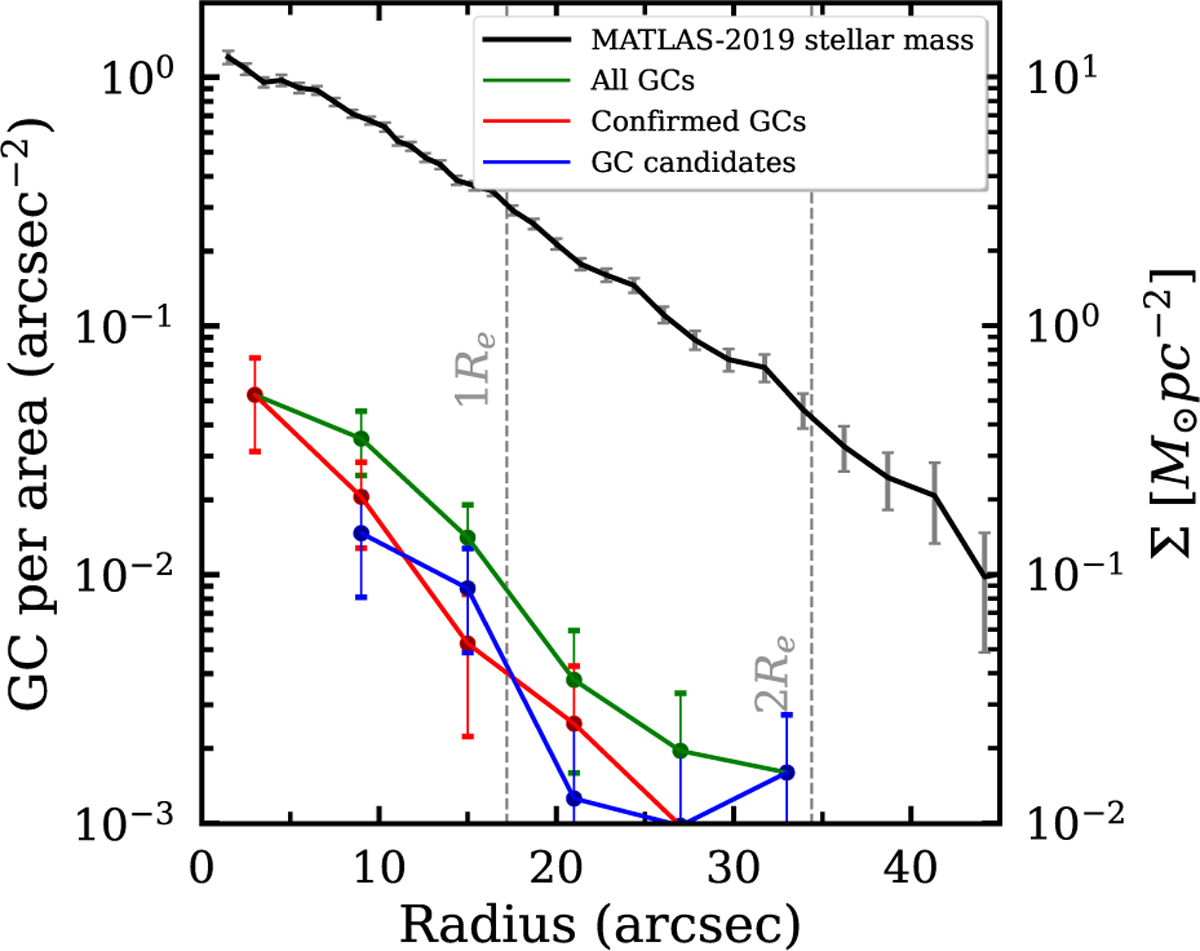
Radial distribution of GC candidates in MATLAS-2019. The red profile represents the spectroscopically confirmed GCs, the GC candidates obtained in this study are in blue, and the whole GC system in green. The black line is the mass density profile of MATLAS-2019, as indicated in the right Y-axis. The errors in the GC profiles are the Poissonian error of the number of GCs per area in each annulus (i.e. ![]() . The dashed vertical grey lines indicate 1Re and 2Re of the galaxy (Re = 17.″2, Müller et al. 2020).
. The dashed vertical grey lines indicate 1Re and 2Re of the galaxy (Re = 17.″2, Müller et al. 2020).
Current usage metrics show cumulative count of Article Views (full-text article views including HTML views, PDF and ePub downloads, according to the available data) and Abstracts Views on Vision4Press platform.
Data correspond to usage on the plateform after 2015. The current usage metrics is available 48-96 hours after online publication and is updated daily on week days.
Initial download of the metrics may take a while.