Fig. 11
Download original image
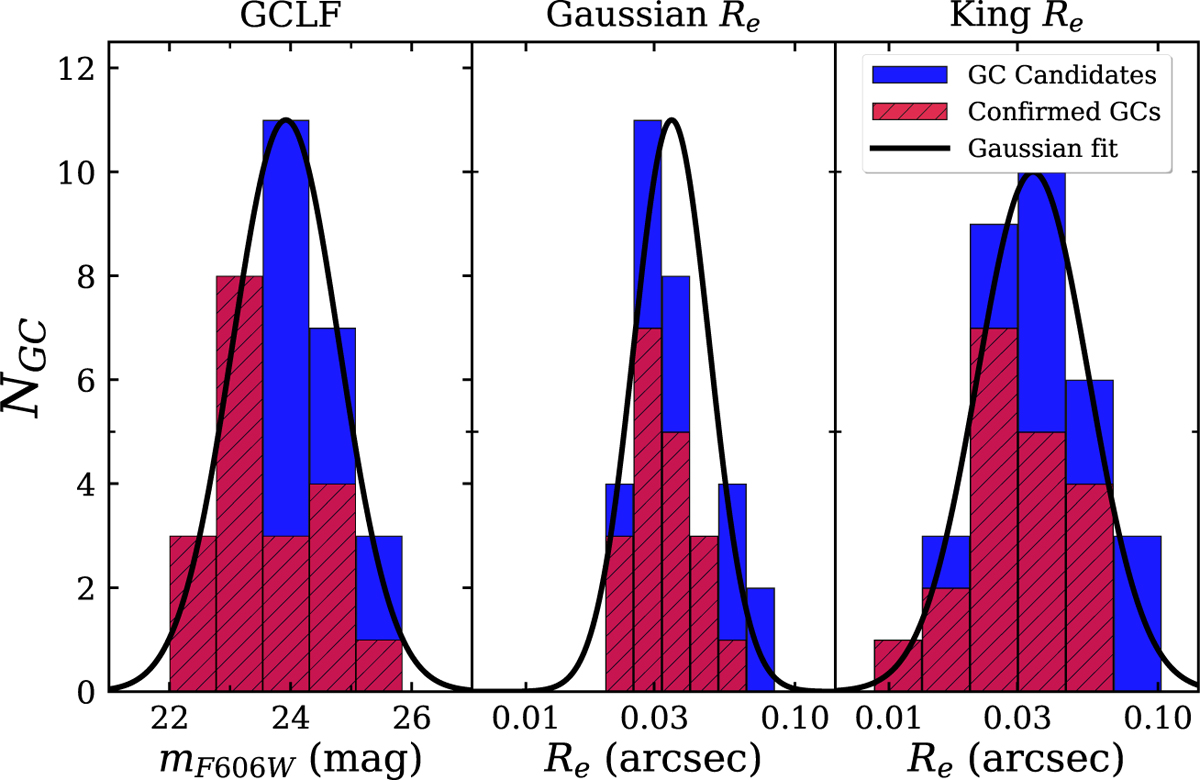
Left panel: globular cluster luminosity function of MATLAS-2019. Middle panel: distribution of Re assuming that the intrinsic shape of the GC is a Gaussian. Right panel: distribution of Re assuming that the intrinsic shape of the GC is a King model. The spectroscopically confirmed GCs from Müller et al. (2020) and Haacke et al. (2025) are indicated in red (hatched), the population identified in this study is in blue. The widths of the bins have been calculated using the Freedman–Diaconis rule (Freedman & Diaconis 1981). The black solid line shows a Gaussian fit to the data.
Current usage metrics show cumulative count of Article Views (full-text article views including HTML views, PDF and ePub downloads, according to the available data) and Abstracts Views on Vision4Press platform.
Data correspond to usage on the plateform after 2015. The current usage metrics is available 48-96 hours after online publication and is updated daily on week days.
Initial download of the metrics may take a while.