Fig. B.1
Download original image
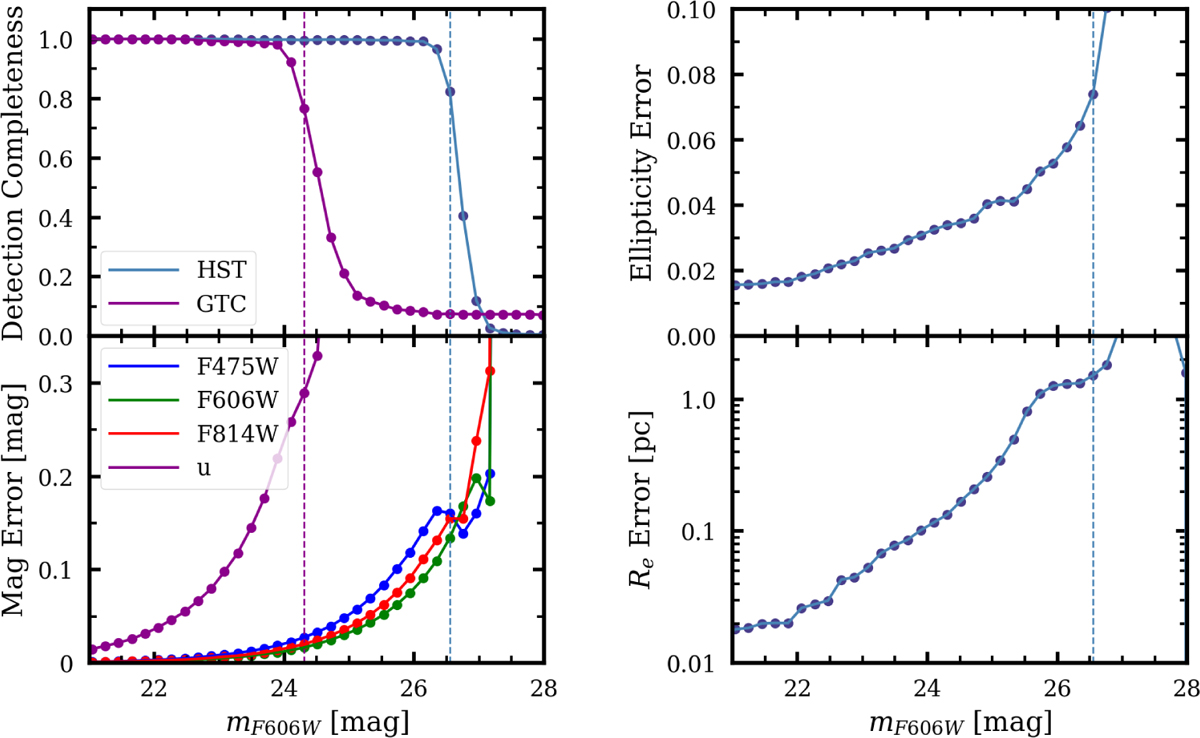
Results of the tests of the injection of mock GCs. Top left: Completeness of the HST data when simultaneously detecting the injected GCs in the three HST bands (blue line) and for the OSIRIS+ u-band (purple line). Bottom left: photometric errors for all the bands used in characterising the GCs of MATLAS-2019. Top right: ellipticity errors in the WFC3/F606W, where the ellipticity is measured. Bottom right: Re errors in the WFC3/F606W, converted to pc assuming a distance of 20.7 Mpc. The dashed vertical lines indicates when the detections fall below 90%.
Current usage metrics show cumulative count of Article Views (full-text article views including HTML views, PDF and ePub downloads, according to the available data) and Abstracts Views on Vision4Press platform.
Data correspond to usage on the plateform after 2015. The current usage metrics is available 48-96 hours after online publication and is updated daily on week days.
Initial download of the metrics may take a while.