Fig. 2
Download original image
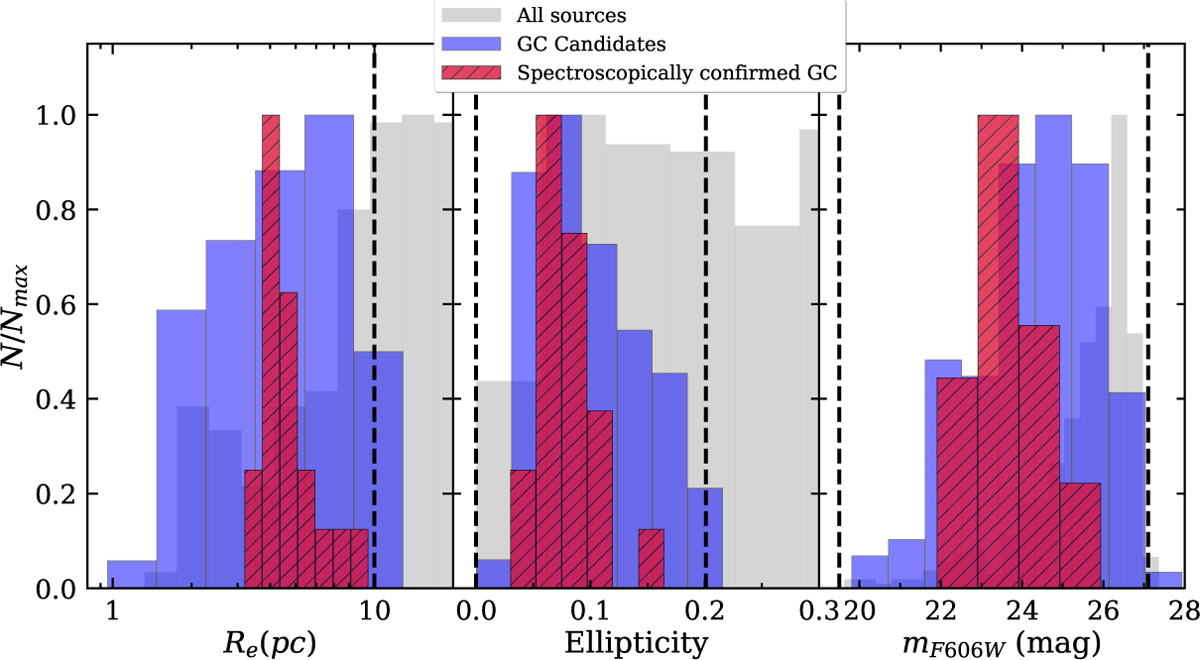
Normalised histograms of the effective radius (in parsecs, assuming a distance of 20.7 Mpc), ellipticity and F606W magnitude of different samples of sources; N is the number of sources in each bin and Nmax the maximum of their respective histograms. The grey histogram shows all the sources of the catalogues in grey (446 sources), the red hatched histogram the 20 spectroscopically confirmed GCs and the blue histogram the sources which fulfil the selection criteria (128 sources). The vertical dashed lines indicate the ranges of the GC selection, in each of the parameters.
Current usage metrics show cumulative count of Article Views (full-text article views including HTML views, PDF and ePub downloads, according to the available data) and Abstracts Views on Vision4Press platform.
Data correspond to usage on the plateform after 2015. The current usage metrics is available 48-96 hours after online publication and is updated daily on week days.
Initial download of the metrics may take a while.