Fig. 3
Download original image
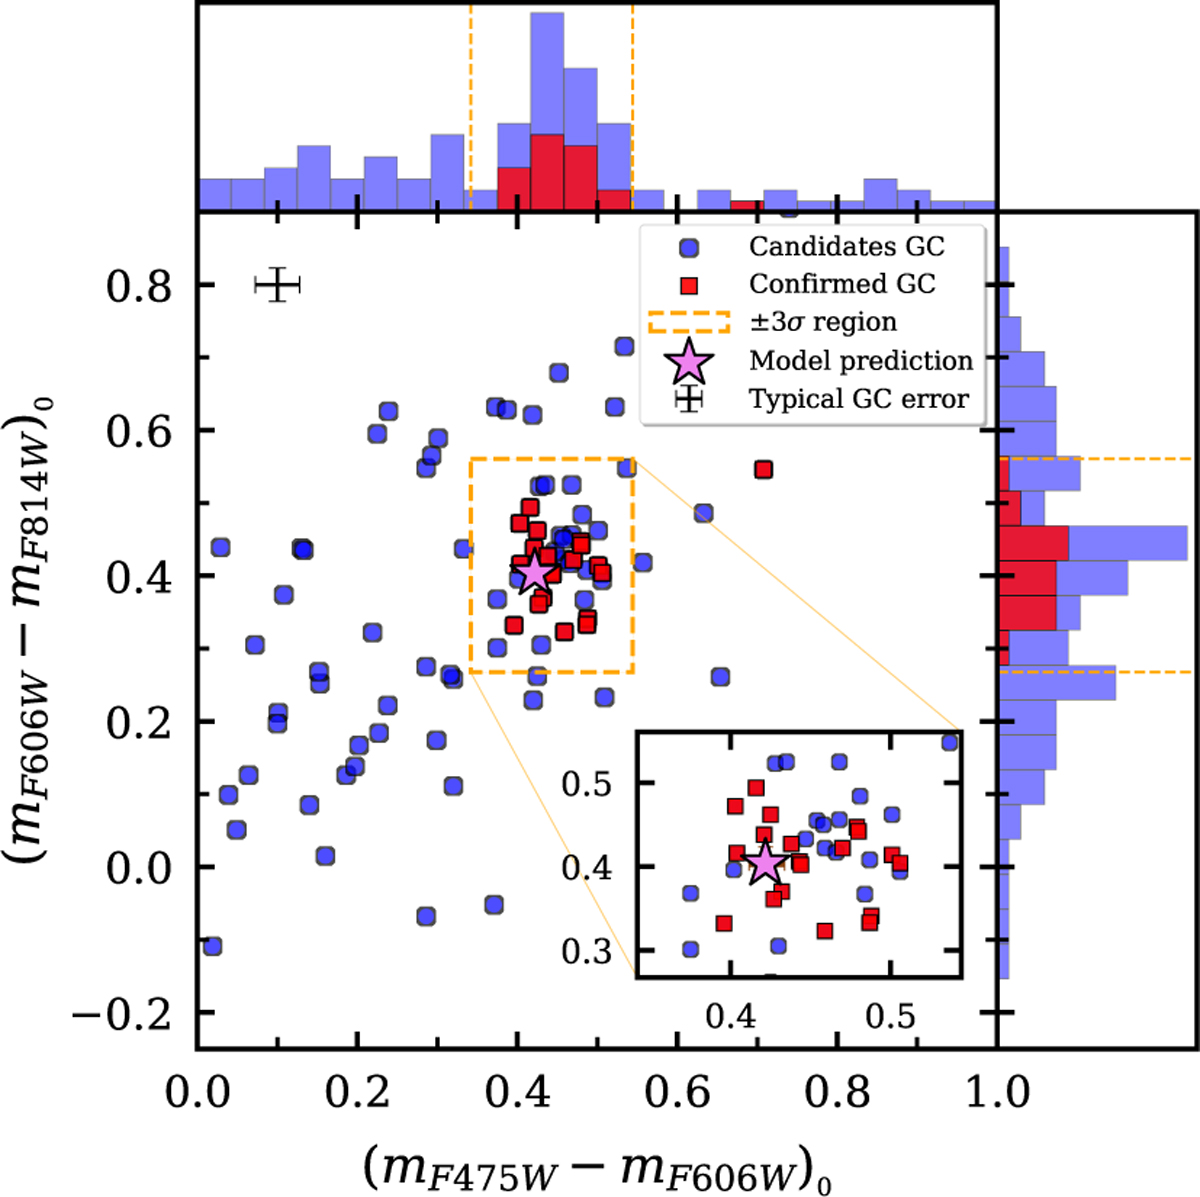
(mF475W − mF606W)0 vs (mF606W − mF814W)0 colour-colour diagram of the initial sample of GC candidates. The 20 spectroscopically confirmed GCs (Müller et al. 2020; Haacke et al. 2025) are shown as red squares. The orange dashed box indicates the region we have selected for our next sample of GC candidates and corresponds to ±3σ around the median colours of the confirmed GCs (excluding the anomalous object, see Sect. 3.3). The violet star, and its error bar, shows the prediction from Bruzual & Charlot (2003) models for an SSP of [Fe/H] = –1.44 dex and 9.1 Gyr (Müller et al. 2020). The inset shows a zoom-in into the dashed orange box for ease of viewing. The error bars shown in the upper-left corner are the errors of an object located at the peak of the GCLF (mF606W = 23.77 mag, assuming a distance of 20.7 Mpc to the galaxy).
Current usage metrics show cumulative count of Article Views (full-text article views including HTML views, PDF and ePub downloads, according to the available data) and Abstracts Views on Vision4Press platform.
Data correspond to usage on the plateform after 2015. The current usage metrics is available 48-96 hours after online publication and is updated daily on week days.
Initial download of the metrics may take a while.