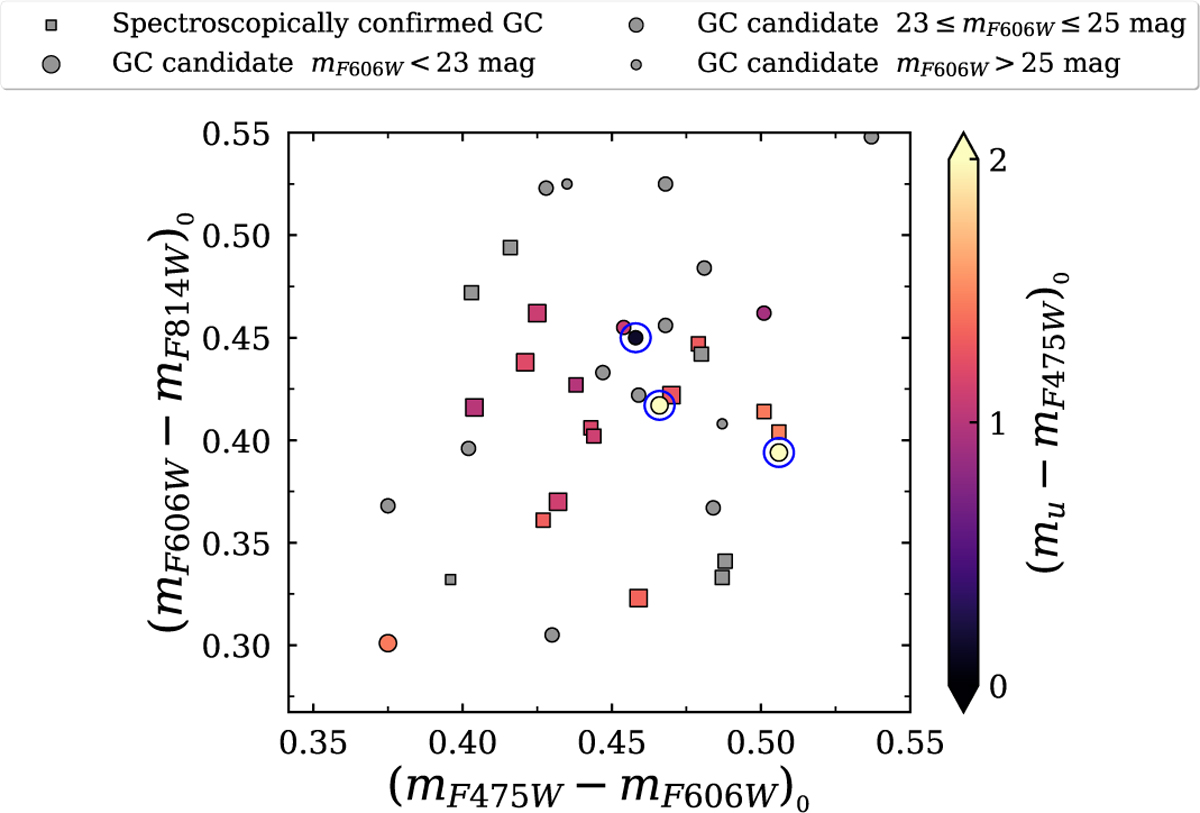
Fig. 4
Download original image
(mF475W −mF606W)0 vs (mF606W −mF814W)0 colour-colour diagram of GC candidates, colour-coded with the (mu − mF475W)0 colour. The 20 spectroscopically confirmed GCs (Müller et al. 2020; Haacke et al. 2025) are shown as squares and the candidates as circles. The size of the marker indicates the mF606W of the source, as shown in the legend. The sources in grey are objects that are too faint to be measured in the u-band. The blue open circles highlight those objects rejected based on their (mu − mF475W)0 colour.
Current usage metrics show cumulative count of Article Views (full-text article views including HTML views, PDF and ePub downloads, according to the available data) and Abstracts Views on Vision4Press platform.
Data correspond to usage on the plateform after 2015. The current usage metrics is available 48-96 hours after online publication and is updated daily on week days.
Initial download of the metrics may take a while.