Fig. 5
Download original image
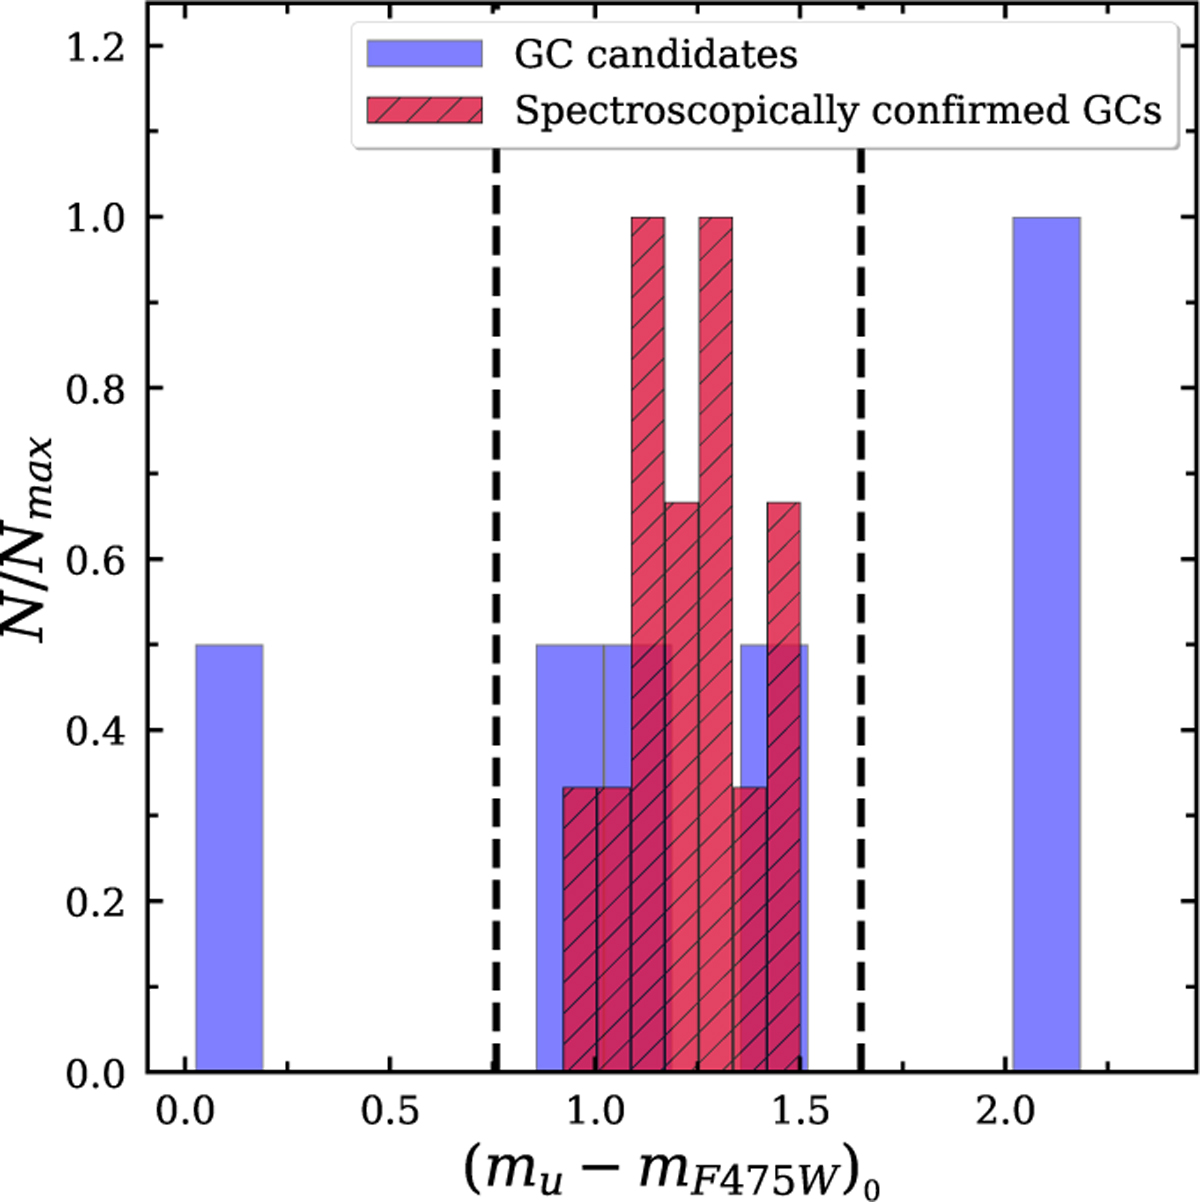
Normalised histograms of the (mu − mF475W)0 colour of the GCs of MATLAS2019; N is the number of sources in each bin and Nmax the maximum of their respective histograms. The red hatched histogram shows the spectroscopically confirmed GCs and the blue histogram the GC candidates. Only sources with trustable magnitude in the u−band are shown (i.e. mu < 25.8, see Sect. 3.3). The dashed vertical black lines indicate the ±3σ cut applied for GC selection.
Current usage metrics show cumulative count of Article Views (full-text article views including HTML views, PDF and ePub downloads, according to the available data) and Abstracts Views on Vision4Press platform.
Data correspond to usage on the plateform after 2015. The current usage metrics is available 48-96 hours after online publication and is updated daily on week days.
Initial download of the metrics may take a while.