Fig. 6
Download original image
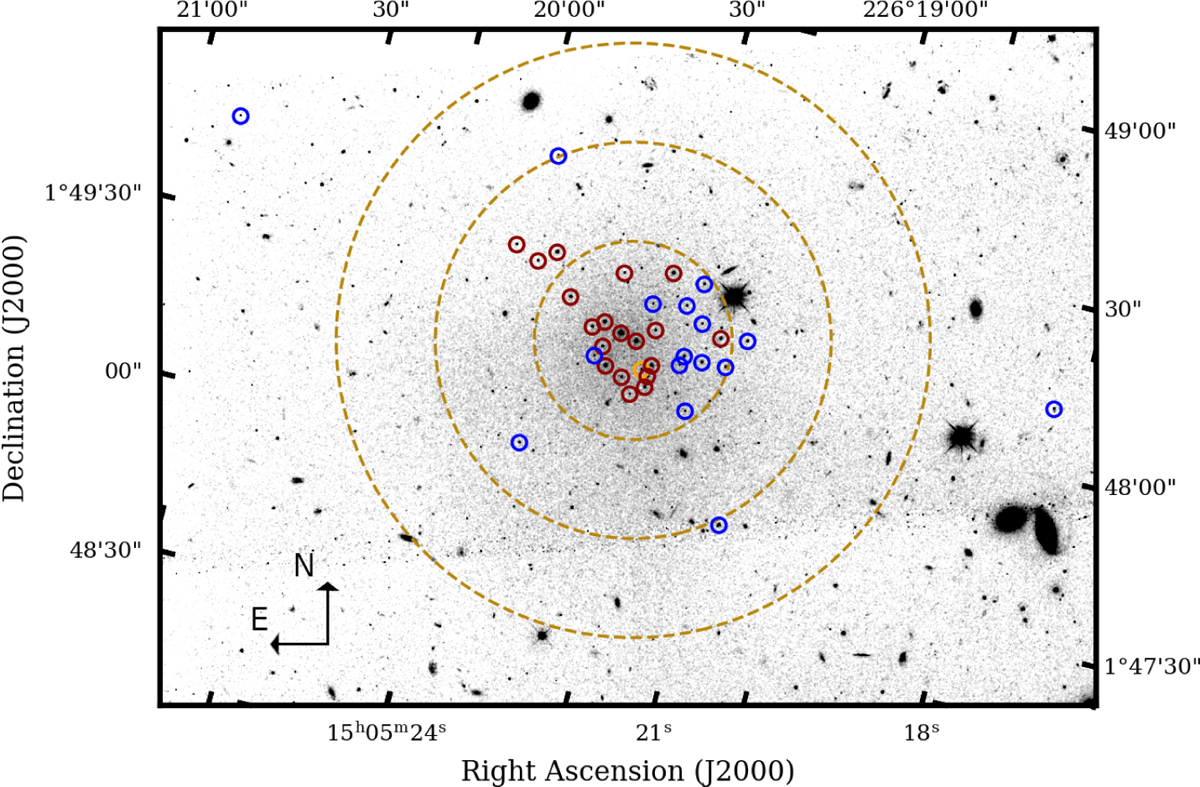
HST WFC3/F606W image convolved with a Gaussian kernel (σ = 1.5) showing the spatial distribution of the GC candidates identified in this work. The red circles indicate the GCs spectroscopically confirmed in Müller et al. (2020) and Haacke et al. (2025) while the blue circles highlight the GCs candidates and the orange circle represent the anomalous GC. The yellow dashed circles indicate 1Re, 2Re and 3Re of the galaxy (Re = 17.″2, Müller et al. 2020).
Current usage metrics show cumulative count of Article Views (full-text article views including HTML views, PDF and ePub downloads, according to the available data) and Abstracts Views on Vision4Press platform.
Data correspond to usage on the plateform after 2015. The current usage metrics is available 48-96 hours after online publication and is updated daily on week days.
Initial download of the metrics may take a while.