| Issue |
A&A
Volume 706, February 2026
|
|
|---|---|---|
| Article Number | A33 | |
| Number of page(s) | 9 | |
| Section | Interstellar and circumstellar matter | |
| DOI | https://doi.org/10.1051/0004-6361/202557248 | |
| Published online | 30 January 2026 | |
Spectral variability of UX Ori in deep minima: Modelling of eclipses
1
Pulkovo Astronomical Observatory, Russian Academy of Sciences,
Pulkovskoe sh. 65,
St. Petersburg
196140,
Russia
2
Nordic Optical Telescope,
Rambla José Ana Fernández Pérez 7,
38711
Breña Baja,
Spain
3
Department of Physics and Astronomy, Aarhus University,
Munkegade 120,
8000
Aarhus C,
Denmark
4
Luleå University of Technology,
971 87
Luleå,
Sweden
★ Corresponding authors: This email address is being protected from spambots. You need JavaScript enabled to view it.
; This email address is being protected from spambots. You need JavaScript enabled to view it.
Received:
15
September
2025
Accepted:
11
December
2025
Abstract
Context. Young stars in the UX Ori family (UXORs) demonstrate irregular brightness variability with varying degrees of depth and duration due to the specific orientation of their nearly edge-on discs with respect to the line of sight. It is supposed that a dusty screen located near the sublimation zone hides the star from the observer by rising above the plane of the disc. During such eclipses the spectrum of the star changes significantly, something that permits us to study both the nearest surroundings of the young star and the nature of the screening objects. The properties and features in the spectrum of UX Ori (a Herbig Ae star of spectral type A3III) have been considered in detail in our previous papers.
Aims. Thanks to long-term observations with the Nordic Optical Telescope (NOT) we found evidence of a substantial change in the Hα line profile of UX Ori: from double-peaked when the star is in its bright state to single-peaked when in deep minimum. Using the spectra obtained during different brightness states we calculated models of the star’s eclipses that can explain the behaviour of the Hα line.
Methods. To solve the problem we calculated models of the emission regions in the nearest vicinity of the star, taking into consideration the zones of magnetospheric accretion and magneto-centrifugal disc wind, the radiation scattered on the circumstellar dust, and the extended disc wind beyond the dust sublimation radius. Line profiles were calculated for the star in its normal (bright) state, as well as during dust eclipses by introducing obscuring gas and dust screens at different positions.
Results. Our modelling reproduces well the observed Hα line profiles, and indicates that the transformation of the Hα line during eclipses is due to the action of two factors: (a) by obscuring the emission of the magnetosphere of the star and that of the inner region of the disc wind with the dusty screen, and (b) by increasing the contribution of the emission from the periphery zone beyond the screen into the total emission. The possibility of applying this model to other UXORs is discussed.
Key words: techniques: photometric / techniques: spectroscopic / stars: individual: UX Ori / stars: individual: RR Tau / stars: variables: T Tauri, Herbig Ae/Be / stars: winds, outflows
© The Authors 2026
 Open Access article, published by EDP Sciences, under the terms of the Creative Commons Attribution License (https://creativecommons.org/licenses/by/4.0), which permits unrestricted use, distribution, and reproduction in any medium, provided the original work is properly cited.
This article is published in open access under the Subscribe to Open model. This email address is being protected from spambots. You need JavaScript enabled to view it. to support open access publication.
1 Introduction
The UXOR family consists mainly of young hot stars (predominantly Herbig Ae stars) with a small addition of T Tauri stars (TTSs). They stand out from other stars by their violent photometric activity due to strong fluctuations of the circum-stellar (CS) extinction. The reason for this activity is the slight tilt of their CS discs with respect to the line of sight. This causal relationship between the disc inclination and the level of the photometric activity of these stars was established during long-lasting photopolarimetric observations started in 1986 at the Crimean astrophysical observatory in cooperation with the Sanglok observatory (Tajikistan; see Grinin et al. 1991, and references therein) and was later confirmed with interferometric observations (Kreplin et al. 2013, 2016).
This conclusion now seems obvious from the point of view of modern astrophysics, but back in those years the dominant opinion was that Herbig AeBe stars are surrounded by gas and dust envelopes where assuming spherical symmetry would be quite acceptable (see e.g. Miroshnichenko et al. 1997). Due to the slight tilt of the CS discs towards the line of sight, photometric monitoring of UXORs allows us to investigate the structure of the nearest surroundings of the stars and the non-stationary processes occurring there.
Another related and equally important area of study is the structure of the emission regions surrounding these stars. High-resolution spectroscopy during the different brightness states in moments of eclipses of the stars by the circumstellar dust clouds are of particular interest here. Such observations have been recently obtained with the instrument FIES at the Nordic Optical Telescope (NOT) for two stars: RR Tau (Grinin et al. 2023) and UX Ori (Tambovtseva et al. 2025). In the current paper we present modelling of the two hydrogen lines Hα and Hβ in the bright state of the star as well as during eclipses.
The paper is organised as follows. In Sect. 2, we describe the emission regions considered, an algorithm of the calculation of the hydrogen line profiles, and an algorithm of screening the star and its environment by the gas and dust cloud. The results of the calculations of the hydrogen line profiles are presented in Sect. 3. In Sect. 4, we consider the special features of the theoretical spectral lines in both brightness states of the star and analyse the main physical mechanisms leading to such behaviour. In addition, we compare results of the modelling of the UX Ori emitting regions with those obtained for another UXOR star, RR Tau. The changes in the line profiles of other elements during eclipses are also analysed. In Sect. 5, we present the main conclusions of our research.
2 Modelling
Modelling of the hydrogen emission lines is a powerful tool in the study of the physical processes occurring near young stars. In our previous papers on this subject we investigated the fundamentals of theoretical modelling of the magnetospheric accretion and the magneto-centrifugal disc wind for Herbig AeBe stars (Grinin & Tambovtseva 2011; Tambovtseva et al. 2014). We also applied the theoretical models to several observed stars (Garcia Lopez et al. 2015; Caratti o Garatti et al. 2015; Kreplin et al. 2018; Tambovtseva et al. 2016, 2020a; Grinin et al. 2023). During those studies we determined the boundaries of the accretion and wind zones and obtained the optimal region where the magneto-centrifugal disc wind is the dominating contributor to the emission in the hydrogen lines. Its inner boundary begins almost from the magnetosphere boundary, and its outer boundary is between a few and a few tens of stellar radii. The contribution from more remote disc wind regions to the radiation was regarded as small and was not taken into consideration. The contribution of the radiation scattered by the CS dust in the formation of the emission lines of young stars was investigated by Grinin et al. (2012) and Tambovtseva et al. (2020b).
During eclipses the dusty screen obscures not only the star, but also the magnetosphere and the inner part of the wind, which makes it possible to observe emission from disc winds originating at a larger distance from the star, beyond the obscuring dusty screen. Taking this into account in our modelling, we include in this paper for the first time the region of the disc wind located beyond the dust sublimation zone.
For this paper we completed the non-LTE modelling of the hydrogen emission lines Hα and Hβ for the Ae Herbig star UX Ori. The stellar parameters adopted are as follows: M∗ = 2.1 M⊙, R∗ = 1.9 R⊙, Teff = 8500 Kq, log g = 4, RV = +18 km s−1 (see details in Tambovtseva et al. 2025). In our modelling we used the Kurucz model with Teff=8500 K and log g = 4 (Kurucz 1979). The inclination angle i was determined for UX Ori using interferometric observation and derived as 70◦ ± 5◦ (i = 0 means face-on viewing; Kreplin et al. 2016). The most detailed calculations were done for the most intense hydrogen line, Hα. As in our previous work (Tambovtseva et al. 2014, 2020a), when calculating the line profiles we adopted the hybrid model that simultaneously includes areas (1)–(3), while in the present paper we include the new area (4):
the region of the matter accreting onto the star as the magnetospheric accretion;
the region of the magneto-centrifugal disc wind launched before the sublimation radius (referred to as the inner disc wind);
the region filled in with the CS dust that re-emits and scatters the radiation of the star, the accreting matter, and the inner disc wind;
the region of the disc wind beyond the sublimation zone not obscured by the screen (referred to as the outer disc wind).
The algorithm of calculations is performed as follows: First we calculate the Hα line profile taking into account all the regions mentioned above, given that the star is in the bright state. We select models that describe observations well enough due to the criteria given in the end of the section. When the modelling eclipses, the inner disc wind is obscured by the screen, but the outer disc wind is not obscured.
It should be noted that many parameters chosen for models are not free. Their choice is either limited or determined by observations. For example, the kinematics of the wind or accretion is determined from the observed line profiles, the geometry of the emission regions is ruled by the theory elaborated for young stars, the size of the emission regions is obtained from the theory and interferometry. The inclination angle for UX Ori is known from the interferometric observations. The reliability of the choice of model parameters increases if we model several emission lines. Our method is verified by simulation of such hydrogen lines as Hα, Hβ, Hγ, Paβ, and Brγ for the different Herbig AeBe stars in the papers cited at the beginning of the section.
After selecting the models suitable as representations of the emitting regions in the bright state, we simulated the eclipse of a star and the regions mentioned above. The details of the method and schemes are presented in Grinin et al. (2023). Figure 1 shows a principle scheme with the positions and sizes of the emitting regions without the detailed topology. We consider briefly the characteristics of each area and the range of the model parameters used for each of them.
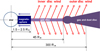 |
Fig. 1 Sketch of the nearest vicinity of UX Ori adopted in the paper. Not to scale. |
2.1 Accretion
The Herbig Ae and late Be stars can accrete matter in the same manner as T Tauri stars (TTSs; Vink et al. 2002, 2005; Mottram et al. 2007; Ababakr et al. 2017). Taking into account the rapid rotation of the Herbig AeBe stars, in particular, about 140 km s−1 for UX Ori (Grinin et al. 2001), we assume that their accretion region is flatter than that of TTSs, and that the accreting matter comes to the moderate latitudes of the stellar surface. The accretion zone is small, it is supported both with observations (Cauley & Johns-Krull 2014, 2015), and our theoretical calculations of the hydrogen line profiles together with the interferometric parameters. Although the accretion region is not large, it plays an important role in the formation of the hydrogen emission lines in Herbig Ae stars. To model the accretion process of UX Ori we applied the same method used for RR Tau (Grinin et al. 2023), described in detail by Tambovtseva et al. (2014).
We briefly list the main points. The radial velocity of the gas is determined from the solution of the equation of motion under gravity. We used a solid rotating magnetosphere. In order to simulate the needed topology we determined the rotational gas velocity by a power law. The electron temperature Te(r) was chosen following the law Te(r) = Te(R∗)(r/R∗)−α, where α is a free parameter and Te(R∗) the electron temperature at the stellar surface. The temperature regime we used was close to that adopted for the classical magnetospheric accretion in TTSs (Hartmann et al. 1994).
The range of the parameters we checked in the calculations is as follows. The co-rotation radius rc was checked in the range of (1.5–2.5) R∗, the velocity at the stellar surface where the accreting matter goes ranges from 70 to 100 km s−1, the mass accretion rate was checked from 10−7 to 5 × 10⁻⁹ M⊙ yr−1. It should be noted that there are two free parameters: (1) the power index α that influences the temperature law, and (2) the mass accretion rate. A choice of these parameters, and the size of the magnetosphere, as well as the region of the star where the gas from the disc goes is determined by observations.
2.2 Inner disc wind
The magneto-centrifugal disc wind in different objects is well studied and described in the literature, for example in the accretion discs around black holes (Blandford & Payne 1982) and in young stars (Pudritz & Norman 1986; Wardle & Koenigl 1993; Ferreira et al. 2006). The modelling of disc winds in TTSs is presented by Kurosawa et al. (2006) and Kurosawa et al. (2011).
An algorithm for disc wind modelling is described in detail in Tambovtseva et al. (2014), where the geometry is shown in their Fig. 1. We briefly summarise the key points. We divide the wind region into a number of streamlines, and choose the parameters of the wind. We compute the velocity and density distribution throughout the region. The wind velocity consists of poloidal and tangential velocity components; the mass may be distributed among the streamlines in a different way with the free parameter γ (Eqs. (1)–(3) in the cited paper). In the present calculations the tangential velocity grows in the co-rotation zone, and it obeys the conservation of angular momentum (Safier 1993; Tambovtseva et al. 2020a).
The gas temperature along the streamlines is assumed to be constant and equal to 10 000 K (Safier 1993; Garcia et al. 2001). We assume that the disc wind consists of hydrogen atoms with a constant temperature (10 000 K) except for the regions just above the disc surface where the temperature is not high enough to excite hydrogen emission lines (less than 6000 K); therefore we exclude from consideration the base of the disc wind.
For all emitting volumes around the star we performed non-LTE modelling of the radiative transfer. The source functions were calculated in the Sobolev approximation (Sobolev 1960), and the intensity of the radiation emergent at frequencies within a spectral line was calculated by exact integration over the spatial coordinates in the approximation of full redistribution over frequency in the co-moving coordinate system.
In the present paper the main parameters of the disc wind were checked in the following ranges. The first footpoint of the disc w1 (the first streamline) ranges from 2R∗ to 3R∗. The half opening angle between the first streamline and the vertical axis (θ1) ranges from 30◦ to 50◦. A scale factor f for the terminal velocity ranges from 2 to 5, and could be constant or variable for each streamline. The mass loss rate is in the range 1 × 10⁻⁹ to 1 × 10⁻⁸M⊙ yr−1.
The free parameters that were chosen from the comparison of the model and observed line profiles are the parameters γ and β. The first parameter allows us to distribute the matter differently over the streamlines, and the second helps to regulate the velocity law (where a smaller β increases the wind acceleration).
2.3 Scattered light
The contribution of the scattered light for UX Ori is 10% of the stellar radiation in the bright state of the star, according to the amplitudes of the deep brightness minima (Grinin 2000).
2.4 Outer disc wind
The outer disc wind was calculated with the same algorithm as the inner disc wind. This wind is extended, and in our models its formation zone begins just beyond the sublimation radius and extends to ∼3 AU. The half opening angle adopted is 45◦. The terminal velocity used in the poloidal velocity law of this wind v∞ = fvesc, where vesc is the escape velocity and f = 2. The tangential velocity is the Keplerian value. The velocity law is given with the parameter β. We checked variants with β = 0.5, 2, 3, and 5, which is from rapid (β = 0.5) to slow (β = 5) gas acceleration.
The mass loss rate used in the calculations is 1 × 10⁻⁹ M⊙ yr−1. The temperature of the wind is adopted to be 6000 K. We suggest that at such distances it has to be intermediate between the temperature of the inner disc wind (8000–10 000 K) and the photoevaporation wind, whose typical temperature is about 5000 K (see e.g. Ercolano et al. 2009, and references therein).
2.5 Modelling of eclipses
The sublimation radius of Herbig Ae stars may exist at the distances of 0.3–0.5 AU (see e.g. Natta et al. 2001; Dullemond et al. 2001; Tannirkulam et al. 2007; Flock et al. 2017). We chose it to be at 0.4 AU, which corresponds to approximately 45 R∗. The screening body has the same parameters that were used in the eclipse model for RR Tau (Grinin et al. 2023), and the positions of the screen are the same as in their Fig. 3. We used the first eclipse scenario where the vertical rise of the screen is dominant (Fig. 4 in the cited paper), although the screen is also moving together with the disc. In the first scenario we fix the screen at a certain azimuthal angle ϕ and raise it up gradually, calculating the line profiles at each screen height. For UX Ori we used a screen with a width of 20 R∗ because, as is shown for RR Tau, this is the minimum width for which all observed and calculated characteristics of the Hα line profile during eclipses coincide, i.e. the behaviour of the equivalent width, the flux in the line, and the ratio of the violet to red peaks (V/R).
The algorithm of the eclipse is as follows. We put the screen at the selected azimuthal angle ϕ and calculate the Hα line profile at the different heights from the disc surface, taking into account all emitting regions: accretion, inner disc wind, scattered radiation, and the emission component of the outer disc wind. Rising higher above the disc, the screen covers the star and the part of the emitting regions, leaving the outer disc wind unchanged. Since the observed profiles are normalised to the current continuum of the star we also normalised the calculated emission line profile to it, and the emission profile of the outer disc wind was also normalised to this continuum.
It should be noted that we did not aim at a detailed adjustment of the line profiles because UX Ori may show significant variations of the line profile from night to night. The more important task was to find a physical reason for the main transformation of the profile during eclipses, and to explain the observed asymmetry, i.e. its blueshifted shape. Therefore, the main criteria used for comparison between the calculated and observed profiles were the following: a coincidence of (1) the width of the profile in the wings and at about half-maximum (fwhm), (2) the peak ratio V/R, (3) the shape of the profile (double-peaked or single-peaked), (4) the asymmetry and the intensity.
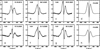 |
Fig. 2 Comparison of the observed (a–c, e–g) and calculated DW1 (d) and DW2 (h) Hα line profiles in the bright state (see details in the text). |
3 Results of modelling: Changes in the line profiles during eclipses
In this section, we present results of calculations of the Hα and Hβ line profiles in the bright state and during an eclipse.
3.1 Hα line: The bright state
In Fig. 2, we present the typical Hα line profiles observed in the bright state (a–c, e–g) and calculated with the models DW1 (d) and DW2 (h) that reproduce the observed lines according to the criteria mentioned above. Calculations showed that the main source of the emission are the accretion and inner disc wind regions nearest to the star.
The main parameters of both disc wind models shown in Fig. 2 are as follows. The mass loss rate is 1 × 10⁻⁹ M⊙ yr−1, the footpoint of the first streamline on the disc surface is 3 R∗ from the star, and the parameter regulating the poloidal velocity acceleration β = 5. The disc wind matter is distributed over streamlines unequally: its main amount is concentrated closer to the star (γ = 3). The models differ with the first half opening angles of the disc wind (related to the first streamline): 45◦ (DW1) and 30◦ (DW2). The last half opening angle (related to the last streamline) is 60◦ in both cases.
The main parameters of the accretion models in DW1 and DW2 are as follows. In both models Te(R∗) = 8500 K, the disc matter goes to the stellar surface at moderate latitudes where the rotational gas velocity is equal to 70 km s−1, the accretion rate is 1 × 10⁻⁸ M⊙ yr−1. The difference between the two accretion models is in the next parameters: the co-rotation radius is 1.5 R∗ (DW1) and 2 R∗ (DW2); the temperature gradient α = 3 (DW1) and 2 (DW2).
3.2 Hα line: Eclipses
Here we consider some properties of the outer disc wind. Figure 3 shows the Hα line profiles obtained with the model of the outer disc wind with the following parameters: the wind half-opening angle is 45◦, the footpoint of the first streamline is at 50 R∗ and the last at 225 R∗ (∼ 2 AU) at the disc surface. The radius of the envelope adopted for calculation is 300 R∗. The parameter γ = 2.5. With this value of γ the matter is distributed approximately in the same proportions over all streamlines. The electron temperature in the wind is constant and adopted to be 6000 K; the mass loss rate with wind is 1 × 10⁻⁹ M⊙ yr−1. The inclination angle i is the same as for the inner disc wind, 70◦.
We computed the model of the outer disc wind with various values of the parameter β regulating its acceleration. It can be seen in Fig. 3 that the Hα line profile is blueshifted. The shift is larger for the gas that accelerates stronger (β = 2). The line profile obtained at the slow acceleration of the wind (β = 5) has little asymmetry, but is also blueshifted. All line profiles are single because the rotation velocity of the disc is low at these distances from the star. The intensity of the outer wind in the Hα line is small, less than 0.2 in the units of the continuum of the star at the normal (bright) state.
As mentioned above, during eclipses the intensity of the radiation at the frequency of the line is normalised to the current continuum; therefore, out-of-eclipse line profiles increase their intensity because the current continuum significantly decreases. In the deep minimum only the contribution from scattered light remains in the continuum. Figure 3 shows how the Hα line profile obtained in the model of the outer disc wind changes from the bright state (1) to the deep minimum (0.1). It is seen that when the brightness fades, the intensity of the normalised line profile increases. This increasing radiation will fill in the central part of that line profile which forms in the region between the star and the sublimation radius. An example of such a transformation of the line profile from the bright state to the deep minimum obtained with model DW1 for the outer disc wind with slow acceleration (β = 5) is shown in Fig. 4. The same, but for the outer disc wind with rapid (β = 2) and moderate (β = 3) acceleration is present in Fig. 5. The height of the screen above the disc surface in units of stellar radii is marked for each profile. The position of the screen (i.e. azimuthal angle) is shown under each column.
As seen from Figs. 4 and 5 the Hα line profile changes its shape from double-peaked to single-peaked when the brightness of the star changes from the normal state to the deep minimum. When the screen is located 15 R∗ above the disc surface, the star is still not eclipsed, as seen from the observer. Instead, when it is at a height of 25 R∗, the star is covered by the screen and a deep minimum of the brightness takes place. When the screen is raised further, the continuum does not undergo further change, and at this state the contribution of the scattered light is 100%. In the figures the central (ϕ = 0) and two nearest (ϕ = ± 5◦) eclipses are shown. One can see that by increasing the height of the obscuring screen the central dip in the line profile is filled in with the growing emission from the outer disc wind, thus leading to a transformation of the double-peaked line profile to a slightly blueshifted single peak. The slower the wind accelerates, the sooner the line profile transformation occurs, i.e. with a lower screen height.
We compare in Fig. 6 the modelled Hα line profile (model DW1) with the observed profile obtained during an eclipse at the end of 2023. This is the same model as shown in Fig. 4 in the column ϕ = 0 with the height of the screen at 24 R∗. During the dates when the line profile was observed, the brightness changed slightly from V = 11.52 to 11.13 magnitudes, nevertheless, the red component of the observed line profile changed radically. The question arises of why the red component of the line profile varies so strongly if the magnetosphere is obscured by the screen. This may occur if the screen itself is not a stable object. Another explanation may be if the process of the magnetospheric accretion is not stable, and one can see this instability due to the presence of the radiation scattered on the CS dust, which is not obscured by the screen. We return to this question in Sect. 4.
In Fig. 7, we show the Hα line profiles observed during eclipse in January 2024. These demonstrate a rather stable shape and are quite well reproduced by the same model as used in Fig. 6, but with the height of the screen at 24.5 R∗. Our calculations showed that the results of modelling differ little for the dust sublimation radius chosen between 0.3 and 0.5 AU.
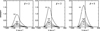 |
Fig. 3 Hα line profile of the outer disc wind with three different velocity laws, marked with the parameter β in each panel. The numbers near the curves indicate stellar brightness from 1 (the bright state) to 0.1 (the deep minimum). |
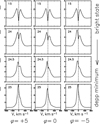 |
Fig. 4 Changes in the Hα line profile, calculated using model DW1 and including the outer disc wind, shown for the bright state (upper panels) and through a fading to the deep minimum (lower panels). The velocity law of the inner disc wind has the parameter β equal to 5. The values of the screen’s height above the disc (in units of stellar radii) are given in each plot, while those of the azimuthal angle are given under each column. |
3.3 Hβ line: The bright state and eclipses
The Hβ line in the spectra of UX Ori is quite unstable; it is in absorption both during the bright state and during the minima (Grinin et al. 2001; Tambovtseva et al. 2025). The observed and calculated Hβ line profiles during the bright state has an inverse P Cygni (IPC) shape. It shows mainly the same shape during the brightness minima, but there is an additional emission at the line centre. In other words, the absorption line profile becomes less deep. Nevertheless, in all cases this shows the signatures of an accretion line profile. Keeping in mind the conditions for formation of this line, i.e. the difference in the absorption coefficients, we conclude that the Hβ line originates in a region located significantly closer to the star than the formation region of the Hα line.
Here, we consider the theoretical Hβ line profile at the bright state. Calculated in the framework of the accretion model without the disc wind, it always has an inverse P Cygni shape; computed including the disc wind, it may remain the IPC IV shape or take the IPC III shape according to the classification scheme of Reipurth et al. (1996). It depends on the properties of the disc wind. Examples of the Hβ line profiles calculated with the model DW1 with various velocity laws, β = 2 (black), β = 3 (red), and β = 5 (blue), are shown in Fig. 8a. The accretion model is the same as used for the Hα calculation. It is seen that if the parameter β ≤ 2, then the line profile remains in the IPC shape unchanged. If β > 2, the density of the disc wind decreases more slowly and begins to have an influence on the line profile, which may become double-peaked due to the appearance of weak emission; however, it always has the peak ratio V/R > 1, which is typical when accretion is the dominating contributor to the emission.
In order to see how the Hβ line profile changes during eclipses we used the same algorithm as for the Hα line. We also calculated the Hβ line profile originating in the outer disc wind, but its intensity turned out to be low, and during eclipses its contribution to the total line was negligible. Therefore, we see changes in the line profiles only when the height of the screen is large (see Fig. 8, and for the inner disc wind with β = 5 (b) and β = 2 (c)). When the height of the screen is equal to 25 R∗ the star is “clouded out” completely, and only radiation from the scattered light remains. The intensity of the line profile increases slightly due to the emission formed in the inner disc wind if it accelerates slowly (Fig. 8b). The line profile practically does not change during eclipses if the inner disc wind accelerates rapidly (Fig. 8c).
Possible reasons for the more significant variations in the Hβ line profiles in the bright and weak states will be discussed in Sect. 4.
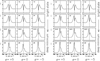 |
Fig. 5 Changes in the Hα line profile during eclipses. The same as in Fig. 4, but for the velocity law of the inner disc wind with β = 2 (left) and β = 3 (right). |
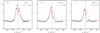 |
Fig. 6 Transformation of the Hα line profile observed at the end of 2023, due to a decrease in the red component (black). The dates and the brightness magnitudes in the visible are shown in each plot. For comparison the calculated line profile of DW1 with the screen height equal to 24 R∗ at ϕ = 0 is presented (red). |
4 Discussion
Modelling of the intense emission lines Hα and Hβ is the most suitable way to study the emission regions of young stars with protoplanetary discs, considering that these very inner regions of the accretion discs are not spatially resolved with modern telescopes. In this section we discuss the main features of these lines during the normal (bright) state of the star and during brightness minima, and we analyse the main physical reasons for their behaviour. In addition, we compare the results of modelling these regions in the star UX Ori with analogical results for RR Tau, a star that belongs to the same UXOR family and was observed with the same instrument and telescope set-up. We also discuss the behaviour of the spectral lines of other elements during the eclipses in light of the results obtained by this modelling.
4.1 Modification of the Hα line profile during eclipses
In the observed spectra of UX Ori the Hα line expressed itself differently during the long-lasting observations. It should be noted that when the star was in the bright state, the line profile maintained its main features: a double-peaked shape, with the blue peak stronger than the red, i.e. the peak ratio V/R greater than one.
This means that the accretion of disc matter onto the star is the dominant physical process even though the size of this region is small. The matter outflow due to the magneto-centrifugal disc wind takes place in a much more extensive region providing the observed wings and intensities, however the wind line profiles were not observed earlier (Grinin et al. 1994, 2001) nor in the observations considered in the present paper. In the different epochs of the last observation with the NOT the intensity of the line during the bright state varied within insignificant limits: from 1.5 to about of 2.2 above the continuum, while at the same time the width of the line profile decreased. The red component of the line changed most noticeably, which indicates a non-stable regime of the accretion.
In the brightness minima the Hα line profile transforms from double-peaked to single-peaked. In the past only one example of such a transformation existed; moreover, the single example was obtained with high spectral resolution during the star eclipse (Grinin et al. 1994). One single episode could not be used for the modelling of the obscuration process, but with the recent long-lasting monitoring of UX Ori (e.g. the eclipse in January 2024; Tambovtseva et al. 2025) we were able to simulate such a transformation of the line profile by including emission from the outer disc wind, located beyond the sublimation zone and not obscured by the screen, as shown in Fig. 1.
It should be noted that during eclipses the Hα line profiles may be double-peaked and single-peaked (see e.g. Fig. A.2. in Tambovtseva et al. 2025), while at the same time showing no significant changes in the line profiles of Hβ and other elements. We wondered why this happens. This may be connected with sudden changes in the physical processes taking place in the magnetosphere of the star (non-stable accretion, variation of the mass accretion rate, or the electron temperature near the stellar surface due to shocks) and/or with non-homogeneity of the matter in the dusty screen. This reasoning assumes that the inner disc wind is not powerful enough to smooth out serious changes in the accretion flux.
An example of the eclipses in 2024 is shown in Fig. 9. One can see the variation of the Hα line profile during consecutive nights in January 2024 (a, b) when the brightness changed by only 0.07 magnitudes and in December 2020 (c).
Modelling eclipses while taking into account the outer disc wind with different velocity laws can explain the slightly blueshifted or almost symmetric (around zero) observed single line profiles of Hα (e.g. seasons of 2023–2024). The out-of-eclipse Hα emission line profile is blueshifted, and therefore even with the screen’s position at positive azimuthal angles ϕ and the height high enough to obscure the inner disc wind, the contribution from the blue part of the outer wind profile begins to dominate. The asymmetry of the line profile depends on how quickly or slowly the velocity of the outer disc wind changes (the parameter β). The most noticeable blueshift is produced with a fast wind, i.e. β ≤ 2. Comparing the model line profiles with the observed ones, taking into account the stellar brightness, can help us determine this parameter.
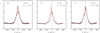 |
Fig. 7 Comparison of the calculated (red) and observed (black) Hα line profiles during eclipses. The model line profile is obtained in the framework of model DW1 with the height of the screen equal to 24.5 R∗ and ϕ = 0. The observed line profiles were obtained in January 2024. The observing date and the brightness given as V-band magnitudes, are shown in each plot. |
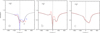 |
Fig. 8 Panel a: influence of the inner disc wind on the Hβ line profile at the bright state. The parameters of the accretion model are as follows: the corotation radius rC = 1.5 R∗, the mass accretion rate 10−8M⊙ yr−1, Te(R∗) = 8500 K, and the power index in the temperature law α = 3. The disc wind model DW1 with β = 2 (black), β = 3 (red), and β = 5 (blue). Panels b and c: influence of the inner disc wind on the Hβ line profile during eclipses. The Hβ line at the bright state (black) and the deep minimum (red) in the same wind and accretion model with β = 5 (b) and β = 2 (c). The height of the dust screen is 25 R∗ above the disc surface. |
4.2 Modification of the Hβ line profile during eclipses
The UX Ori spectra did not show any distinct systematics in the changes of the Hβ line, except for the appearance of additional emission when the star is fading. Nevertheless, it is difficult to build a clear picture of eclipses because this line profile originates mainly in the accretion zone, which is practically completely covered by the screen during eclipses. The added emission reveals itself by making the central part of the absorption line profile less deep. Modelling of Hβ during eclipses showed that the outer disc wind does not play an important role for this transition; its emission is negligible and cannot influence the profile shape.
We wanted to discover what causes the additional emission in this line during the brightness minima. As the calculations show, an increase in the emission can take place due to the following physical reasons: (1) the instability of the accretion process, i.e. an increase in the mass accretion rate, and an increase in the electron temperature near the star surface due to the shocks, and thus due to its higher value on the outer boundary of the magnetosphere; (2) the instability of the inner disc wind, i.e. variations in the opacity of the inner disc wind on the line of sight. However, there may be an external reason for variations in the structure or the density distribution of the obscuring body. This problem requires further study. Although the magnetosphere and the part of the disc wind are closed from the observer during eclipses, we can see accretion details in the Hα and Hβ lines owing to the scattered light; its contribution to the radiation is large enough: 10% of the star radiation in the bright state.
All the reasons mentioned above – instability in the accretion and wind, weak power of the inner disc wind, strong influence of the scattered light, a negligible contribution of the outer disc wind, the simplicity of the accretion model – do not allow us to obtain the observed Hβ line profiles exactly. Since this line forms in the very unstable zone and does not demonstrate a clear change in the line profile with the brightness, we cannot consider it as a tool that could help us to study the structure of the emitting regions comprehensively. Therefore, the Hα line remains the main source of the investigation.
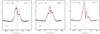 |
Fig. 9 Examples of calculated (red) and observed (black) Hα line profiles during eclipses. The line profile is calculated with model DW1 shown in panel d in Fig. 2. The velocity law of the outer disc wind has β = 5, the screen width W = 20 R∗, and the height of the screen is 24 R∗. The azimuthal angle ϕ = 0 (a, b) and ϕ = −5◦ (c). The observed profiles are from January 2024 (a, b) and December 2020 (c) with stellar brightness marked as V-band magnitudes in the panels. |
4.3 Comparison of modelling results with those of RR Tau
RR Tau belongs to the same family of stars as UX Ori (UXORs), it was one of the targets monitored with NOT in the period 2019– 2022. In this subsection we compare the results of modelling the hydrogen line profiles with those of RR Tau, presented in Grinin et al. (2023). The stellar parameters of RR Tau (A0 III–IV) are as follows: the mass of the star M∗ = 2.5 M⊙, the radius R∗ = 2.1 R⊙, Teff = 9750 K, log g = 3.5 (Rostopchina 1999), the radial velocity RV = +11 km s−1 (Grinin et al. 2001). The contribution from scattered light to the V-band flux is 3% in the bright state for this star (Grinin 2000).
A comparative analysis of the observed spectral variability of UX Ori and RR Tau is given in Tambovtseva et al. (2025). For RR Tau the Hα line profile maintains its double-peaked shape during eclipses, keeping the ratio V/R less than one, while for UX Ori the profile may change from double-peaked to single-peaked. In the case of RR Tau the Hβ profile changes its shape during eclipses from inverse P Cygni to double-peaked emission profile with changing V/R ratios. Instead, for UX Ori during eclipses Hβ keeps the IPC shape, but at its line centre an additional emission feature may appear. We concluded that the disc wind of UX Ori is weaker than that of RR Tau. Analysing the hydrogen line modelling provides the answer to the question of why the Hα lines during the eclipses of RR Tau remain double-peaked. We compare the Hα profiles of both stars. For RR Tau the intensity of the Hα line in continuum units is high, 4–5 at the bright states and 30–40 in the deep minimum. For UX Ori the intensity of the line is low, 1.5–2.5 at the bright states and barely 3, rarely 4–5, during minima. The next result of Hα line modelling suggests the power in the inner disc wind differs for the two stars. In our models the deep minimum, i.e. when the star is fully eclipsed by the screen and only scattered radiation remains, happens for RR Tau when the height of the screen equals 30 R∗ and for UX Ori when the screen is at 25 R∗ above the disc. Thus, we conclude that the power of the inner disc wind of RR Tau is larger due to the higher mass loss rate than that of UX Ori, and the contribution of the emission from the outer disc wind does not give a noticeable change in the shape of the Hα line profile of RR Tau since the emission is dominated by the inner disc wind. However, the existence of the outer disc wind explains well the emission appearing in the spectral lines of some metals during eclipses (e.g. Fe II, Si II, and HeI, NaI D lines (Grinin et al. 2023)). Another confirmation of the existence of the outer disc wind is the behaviour of the forbidden lines of the neutral oxygen [OI] at 6300 Å in the normal and weak states of UX Ori and RR Tau. We suggested that these lines originate at the periphery, in the region not obscured by the dusty screen. However, the star UX Ori has very weak oxygen forbidden lines compared to those of RR Tau (see Figs. 8 and 9 in Tambovtseva et al. 2025).
Comparing the modelling results for the two stars, we conclude that the role of the magnetosphere for UX Ori is greater that that for RR Tau. This is seen, for example, in the shape of the Hβ line during eclipses: it is inverse P Cygni for UX Ori and double-peaked with the peak ratio V/R ≤ 1 for RR Tau. We suggest that the inner disc wind of UX Ori is not powerful enough to mask changes in the hydrogen line profiles caused by instability of the accretion process.
In addition, the stars have a different contribution of scattered radiation when in the bright state, i.e. 2–3% of the total radiation for RR Tau and 10% for UX Ori. The inclination angle of RR Tau is probably greater than that of UX Ori, which is observed through the more unstable atmosphere of the accretion disc.
4.4 Outer disc wind
Emission from the outer disc wind explains well the transformation from a double-peaked Hα line profile to single-peaked during eclipses. When choosing its parameters we were guided by the physical conditions in the region of its launch: (1) the wind starts beyond the sublimation radius; (2) it has to be extended, but not so much that it goes into the photoevaporation wind zone; (3) its terminal velocity is proportional to the escape velocity. The temperature and the mass loss rate were chosen based on comparison of modelling results and observations. This wind exists in both stars and reveals itself at the brightness minima in the lines of metals. In a strong line such as Hα in RR Tau, however, its contribution is small. In the spectra of UX Ori at brightness minima the outer disc wind reveals itself in the Hα line, and in the lines of some metals, but it does not have any influence on the He I line.
5 Conclusion
Modelling of the hydrogen spectral lines during the brightness minima of UX Ori led us to draw the following conclusions:
Modification of the Hα line profile when obscured by a dusty screen with the dominant vertical rise is well explained by the addition of emission from the outer disc wind, originating in a region that is not obscured during eclipses. The outer disc wind fills in the central dip of the line profile with its emission and provides the observed profile shape;
The red component of the line profile for which the matter accretion is responsible is the most variable. This implies a non-stationary accretion process and insufficient power of the inner disc wind to smooth distortions of the Hα line profile;
In spite of the important role of accretion, the shape and parameters of the line profiles during eclipses depend on the dynamics of the inner and outer disc wind. The larger the acceleration of the outer disc wind, the more the Hα line profile is blueshifted;
The modelled Hβ line profile has an inverse P Cygni shape both at the bright and weak states. During eclipses some amount of the emission is added at the line centre that also depends on the inner disc wind dynamics;
The outer disc wind exists all the time, but reveals itself when the star and the part of the circumstellar envelope is obscured by the dusty screen. In addition to the hydrogen lines, this is manifested in the appearance of additional blueshifted emissions in the spectral lines of the metals;
The scattered light plays an important role in formation of the spectra of young stars. The dusty screen is able to cover the star and a significant part of the envelope near the star, but it cannot obscure the radiation scattered off the circumstellar dust that provides a boundary for the fall in the brightness. Due to its presence, one can see the accretion type of the line profiles even during a total eclipse of the star.
Data availability
All the data used as a reference for the modelling in this paper are described in Tambovtseva et al. (2025) with proper acknowledge to the Nordic Optical Telescope (NOT) for FIES spectroscopy and to the Swedish Association of Amateur Astronomers (SAAF) for providing photometric monitoring. We repeat here that all FIES data is available in the online FITS archive1. Practically all the photometry observed by SAAF is available in AAVSO2 or otherwise available by request to the authors.
Acknowledgements
We thank the reviewer who provided constructive questions and comments which helped to improve the manuscript.
References
- Ababakr, K. M., Oudmaijer, R. D., & Vink, J. S. 2017, MNRAS, 472, 854 [NASA ADS] [CrossRef] [Google Scholar]
- Blandford, R. D., & Payne, D. G. 1982, MNRAS, 199, 883 [CrossRef] [Google Scholar]
- Caratti o Garatti, A., Tambovtseva, L. V., Garcia Lopez, R., et al. 2015, A&A, 582, A44 [NASA ADS] [CrossRef] [EDP Sciences] [Google Scholar]
- Cauley, P. W., & Johns-Krull, C. M. 2014, ApJ, 797, 112 [NASA ADS] [CrossRef] [Google Scholar]
- Cauley, P. W., & Johns-Krull, C. M. 2015, ApJ, 810, 5 [NASA ADS] [CrossRef] [Google Scholar]
- Dullemond, C. P., Dominik, C., & Natta, A. 2001, ApJ, 560, 957 [NASA ADS] [CrossRef] [Google Scholar]
- Ercolano, B., Clarke, C. J., & Drake, J. J. 2009, ApJ, 699, 1639 [Google Scholar]
- Ferreira, J., Dougados, C., & Cabrit, S. 2006, A&A, 453, 785 [NASA ADS] [CrossRef] [EDP Sciences] [Google Scholar]
- Flock, M., Fromang, S., Turner, N. J., & Benisty, M. 2017, ApJ, 835, 230 [CrossRef] [Google Scholar]
- Garcia, P. J. V., Ferreira, J., Cabrit, S., & Binette, L. 2001, A&A, 377, 589 [NASA ADS] [CrossRef] [EDP Sciences] [Google Scholar]
- Garcia Lopez, R., Tambovtseva, L. V., Schertl, D., et al. 2015, A&A, 576, A84 [NASA ADS] [CrossRef] [EDP Sciences] [Google Scholar]
- Grinin, V. P. 2000, in Astronomical Society of the Pacific Conference Series, 219, Disks, Planetesimals, and Planets, eds. G. Garzón, C. Eiroa, D. de Winter, & T. J. Mahoney, 216 [Google Scholar]
- Grinin, V. P., & Tambovtseva, L. V. 2011, Astron. Rep., 55, 704 [NASA ADS] [CrossRef] [Google Scholar]
- Grinin, V. P., Kiselev, N. N., Minikulov, N. K., Chernova, G. P., & Voshchinnikov, N. V. 1991, Ap & SS, 186, 283 [Google Scholar]
- Grinin, V. P., The, P. S., de Winter, D., et al. 1994, A&A, 292, 165 [NASA ADS] [Google Scholar]
- Grinin, V. P., Kozlova, O. V., Natta, A., et al. 2001, A&A, 379, 482 [NASA ADS] [CrossRef] [EDP Sciences] [Google Scholar]
- Grinin, V. P., Tambovtseva, L. V., & Weigelt, G. 2012, A&A, 544, A45 [NASA ADS] [CrossRef] [EDP Sciences] [Google Scholar]
- Grinin, V. P., Tambovtseva, L. V., Djupvik, A. A., et al. 2023, MNRAS, 524, 4047 [NASA ADS] [CrossRef] [Google Scholar]
- Hartmann, L., Hewett, R., & Calvet, N. 1994, ApJ, 426, 669 [Google Scholar]
- Kreplin, A., Weigelt, G., Kraus, S., et al. 2013, A&A, 551, A21 [NASA ADS] [CrossRef] [EDP Sciences] [Google Scholar]
- Kreplin, A., Madlener, D., Chen, L., et al. 2016, A&A, 590, A96 [NASA ADS] [CrossRef] [EDP Sciences] [Google Scholar]
- Kreplin, A., Tambovtseva, L., Grinin, V., et al. 2018, MNRAS, 476, 4520 [NASA ADS] [CrossRef] [Google Scholar]
- Kurosawa, R., Harries, T. J., & Symington, N. H. 2006, MNRAS, 370, 580 [NASA ADS] [CrossRef] [Google Scholar]
- Kurosawa, R., Romanova, M. M., & Harries, T. J. 2011, MNRAS, 416, 2623 [NASA ADS] [CrossRef] [Google Scholar]
- Kurucz, R. L. 1979, ApJS, 40, 1 [NASA ADS] [CrossRef] [Google Scholar]
- Miroshnichenko, A., Ivezić, Ž., & Elitzur, M. 1997, ApJ, 475, L41 [Google Scholar]
- Mottram, J. C., Vink, J. S., Oudmaijer, R. D., & Patel, M. 2007, MNRAS, 377, 1363 [NASA ADS] [CrossRef] [Google Scholar]
- Natta, A., Prusti, T., Neri, R., et al. 2001, A&A, 371, 186 [NASA ADS] [CrossRef] [EDP Sciences] [Google Scholar]
- Pudritz, R. E., & Norman, C. A. 1986, ApJ, 301, 571 [NASA ADS] [CrossRef] [Google Scholar]
- Reipurth, B., Pedrosa, A., & Lago, M. T. V. T. 1996, A&AS, 120, 229 [Google Scholar]
- Rostopchina, A. N. 1999, Astron. Rep., 43, 113 [NASA ADS] [Google Scholar]
- Safier, P. N. 1993, ApJ, 408, 115 [NASA ADS] [CrossRef] [Google Scholar]
- Sobolev, V. V. 1960, Moving Envelopes of Stars (Cambridge: Harvard University Press) [Google Scholar]
- Tambovtseva, L. V., Grinin, V. P., & Weigelt, G. 2014, A&A, 562, A104 [NASA ADS] [CrossRef] [EDP Sciences] [Google Scholar]
- Tambovtseva, L. V., Grinin, V. P., & Weigelt, G. 2016, A&A, 590, A97 [NASA ADS] [CrossRef] [EDP Sciences] [Google Scholar]
- Tambovtseva, L. V., Grinin, V. P., & Dmitriev, D. V. 2020a, Astron. Rep., 64, 1026 [NASA ADS] [CrossRef] [Google Scholar]
- Tambovtseva, L. V., Kreplin, A., Grinin, V. P., & Weigelt, G. 2020b, Astron. Rep., 64, 336 [Google Scholar]
- Tambovtseva, L. V., Djupvik, A. A., Grinin, V. P., et al. 2025, A&A, 694, A257 [NASA ADS] [CrossRef] [EDP Sciences] [Google Scholar]
- Tannirkulam, A., Harries, T. J., & Monnier, J. D. 2007, ApJ, 661, 374 [NASA ADS] [CrossRef] [Google Scholar]
- Vink, J. S., Drew, J. E., Harries, T. J., & Oudmaijer, R. D. 2002, MNRAS, 337, 356 [CrossRef] [Google Scholar]
- Vink, J. S., Drew, J. E., Harries, T. J., Oudmaijer, R. D., & Unruh, Y. 2005, MNRAS, 359, 1049 [CrossRef] [Google Scholar]
- Wardle, M., & Koenigl, A. 1993, ApJ, 410, 218 [Google Scholar]
All Figures
|
Fig. 1 Sketch of the nearest vicinity of UX Ori adopted in the paper. Not to scale. |
| In the text | |
|
Fig. 2 Comparison of the observed (a–c, e–g) and calculated DW1 (d) and DW2 (h) Hα line profiles in the bright state (see details in the text). |
| In the text | |
|
Fig. 3 Hα line profile of the outer disc wind with three different velocity laws, marked with the parameter β in each panel. The numbers near the curves indicate stellar brightness from 1 (the bright state) to 0.1 (the deep minimum). |
| In the text | |
|
Fig. 4 Changes in the Hα line profile, calculated using model DW1 and including the outer disc wind, shown for the bright state (upper panels) and through a fading to the deep minimum (lower panels). The velocity law of the inner disc wind has the parameter β equal to 5. The values of the screen’s height above the disc (in units of stellar radii) are given in each plot, while those of the azimuthal angle are given under each column. |
| In the text | |
|
Fig. 5 Changes in the Hα line profile during eclipses. The same as in Fig. 4, but for the velocity law of the inner disc wind with β = 2 (left) and β = 3 (right). |
| In the text | |
|
Fig. 6 Transformation of the Hα line profile observed at the end of 2023, due to a decrease in the red component (black). The dates and the brightness magnitudes in the visible are shown in each plot. For comparison the calculated line profile of DW1 with the screen height equal to 24 R∗ at ϕ = 0 is presented (red). |
| In the text | |
|
Fig. 7 Comparison of the calculated (red) and observed (black) Hα line profiles during eclipses. The model line profile is obtained in the framework of model DW1 with the height of the screen equal to 24.5 R∗ and ϕ = 0. The observed line profiles were obtained in January 2024. The observing date and the brightness given as V-band magnitudes, are shown in each plot. |
| In the text | |
|
Fig. 8 Panel a: influence of the inner disc wind on the Hβ line profile at the bright state. The parameters of the accretion model are as follows: the corotation radius rC = 1.5 R∗, the mass accretion rate 10−8M⊙ yr−1, Te(R∗) = 8500 K, and the power index in the temperature law α = 3. The disc wind model DW1 with β = 2 (black), β = 3 (red), and β = 5 (blue). Panels b and c: influence of the inner disc wind on the Hβ line profile during eclipses. The Hβ line at the bright state (black) and the deep minimum (red) in the same wind and accretion model with β = 5 (b) and β = 2 (c). The height of the dust screen is 25 R∗ above the disc surface. |
| In the text | |
|
Fig. 9 Examples of calculated (red) and observed (black) Hα line profiles during eclipses. The line profile is calculated with model DW1 shown in panel d in Fig. 2. The velocity law of the outer disc wind has β = 5, the screen width W = 20 R∗, and the height of the screen is 24 R∗. The azimuthal angle ϕ = 0 (a, b) and ϕ = −5◦ (c). The observed profiles are from January 2024 (a, b) and December 2020 (c) with stellar brightness marked as V-band magnitudes in the panels. |
| In the text | |
Current usage metrics show cumulative count of Article Views (full-text article views including HTML views, PDF and ePub downloads, according to the available data) and Abstracts Views on Vision4Press platform.
Data correspond to usage on the plateform after 2015. The current usage metrics is available 48-96 hours after online publication and is updated daily on week days.
Initial download of the metrics may take a while.