Fig. 3
Download original image
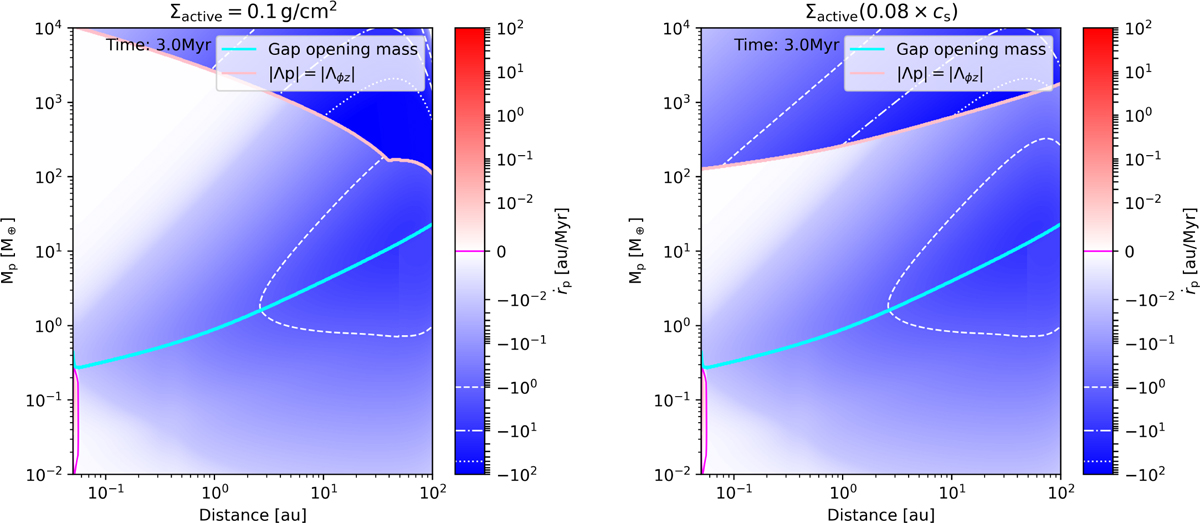
Migration rate as a function of orbital distance and planetary mass for the exemplary disc evolution at 3 Myrs (see Sect. 2.1.5). The cyan line marks the transition from type I to type II migration through gap opening. The pink line denotes the transition into the wind-driven type II migration regime. The left panel shows the migration map for Σactive = 0.1 g/cm2 and the right panel shows the migration map for Σactive (0.08×cs).
Current usage metrics show cumulative count of Article Views (full-text article views including HTML views, PDF and ePub downloads, according to the available data) and Abstracts Views on Vision4Press platform.
Data correspond to usage on the plateform after 2015. The current usage metrics is available 48-96 hours after online publication and is updated daily on week days.
Initial download of the metrics may take a while.