Fig. 4
Download original image
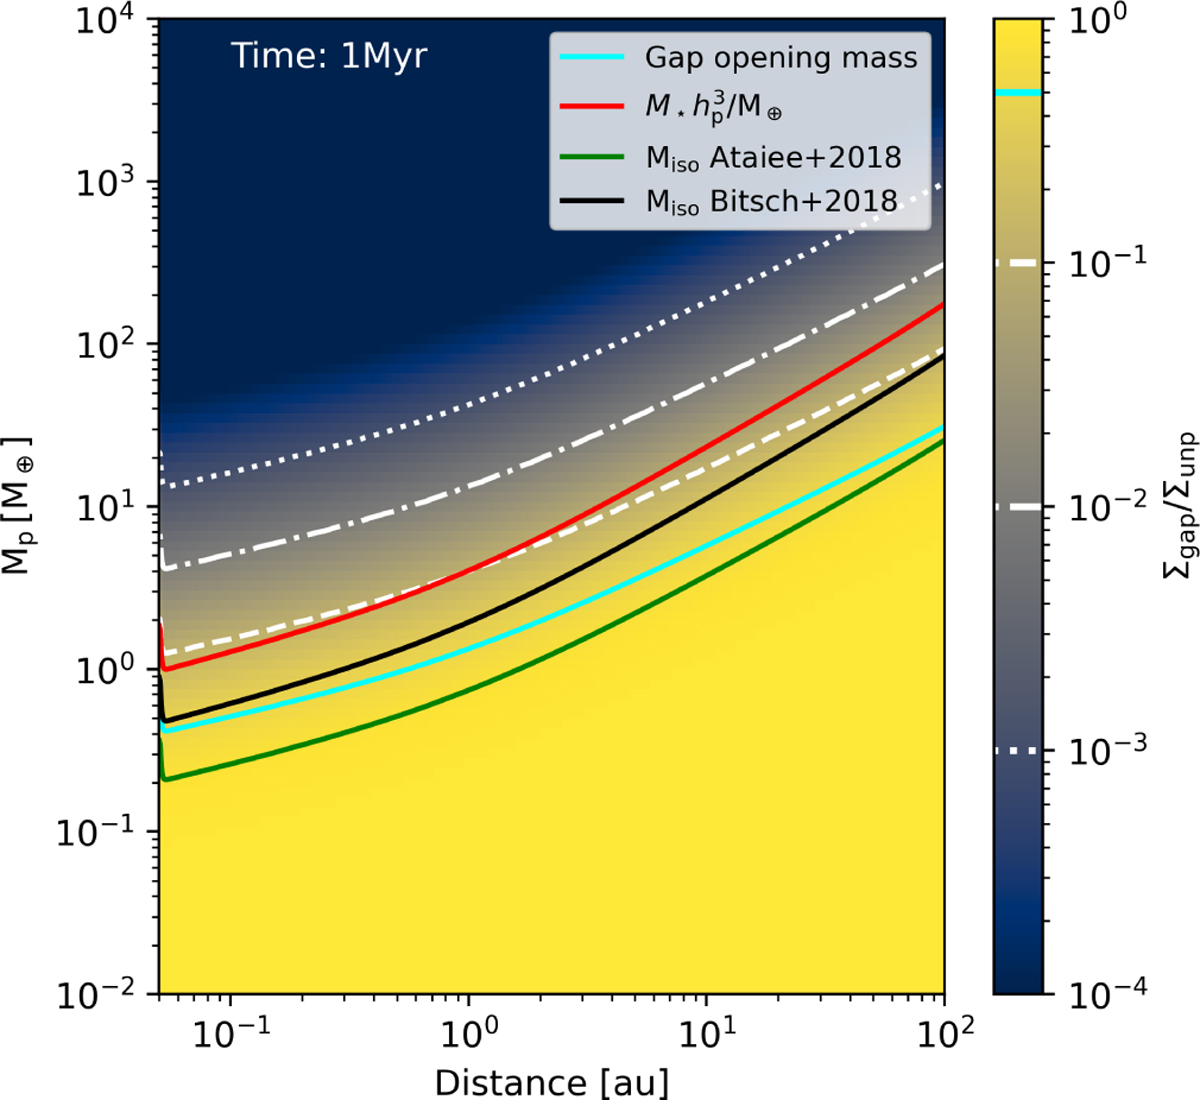
Map showing the reduced surface density in the gap as a function of planetary mass for the exemplary disc evolution at 1 Myr (see Sect. 2.1.5), calculated using Eq. (11). The cyan line corresponds to the gap opening mass with the criterion Σgap/Σunp = 0.5. We show pebble isolation mass formulas from Bitsch et al. (2018) and Ataiee et al. (2018) in green and black and the red line corresponds to the thermal mass criterion.
Current usage metrics show cumulative count of Article Views (full-text article views including HTML views, PDF and ePub downloads, according to the available data) and Abstracts Views on Vision4Press platform.
Data correspond to usage on the plateform after 2015. The current usage metrics is available 48-96 hours after online publication and is updated daily on week days.
Initial download of the metrics may take a while.