Fig. 5
Download original image
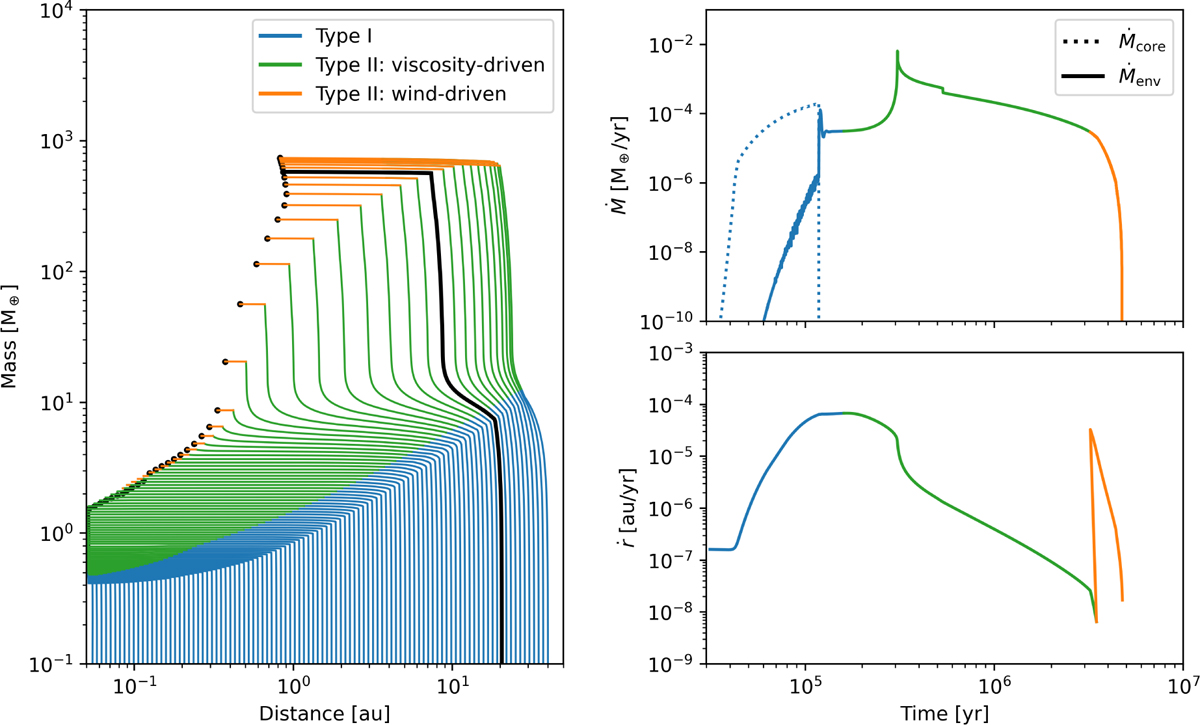
Formation tracks compiled from 100 individual single embryo simulations (Memb = 10−2 M⊕) with varying initial locations rstart spaced uniform in log between 0.05 au and 40 au for our exemplary disc discussed in Section 2.1.5. The tracks are coloured by migration regime. Time evolution of the planet’s accretion rate (core and envelope) and migration rate are shown as an example for a planet with rstart ≃ 20 au.
Current usage metrics show cumulative count of Article Views (full-text article views including HTML views, PDF and ePub downloads, according to the available data) and Abstracts Views on Vision4Press platform.
Data correspond to usage on the plateform after 2015. The current usage metrics is available 48-96 hours after online publication and is updated daily on week days.
Initial download of the metrics may take a while.