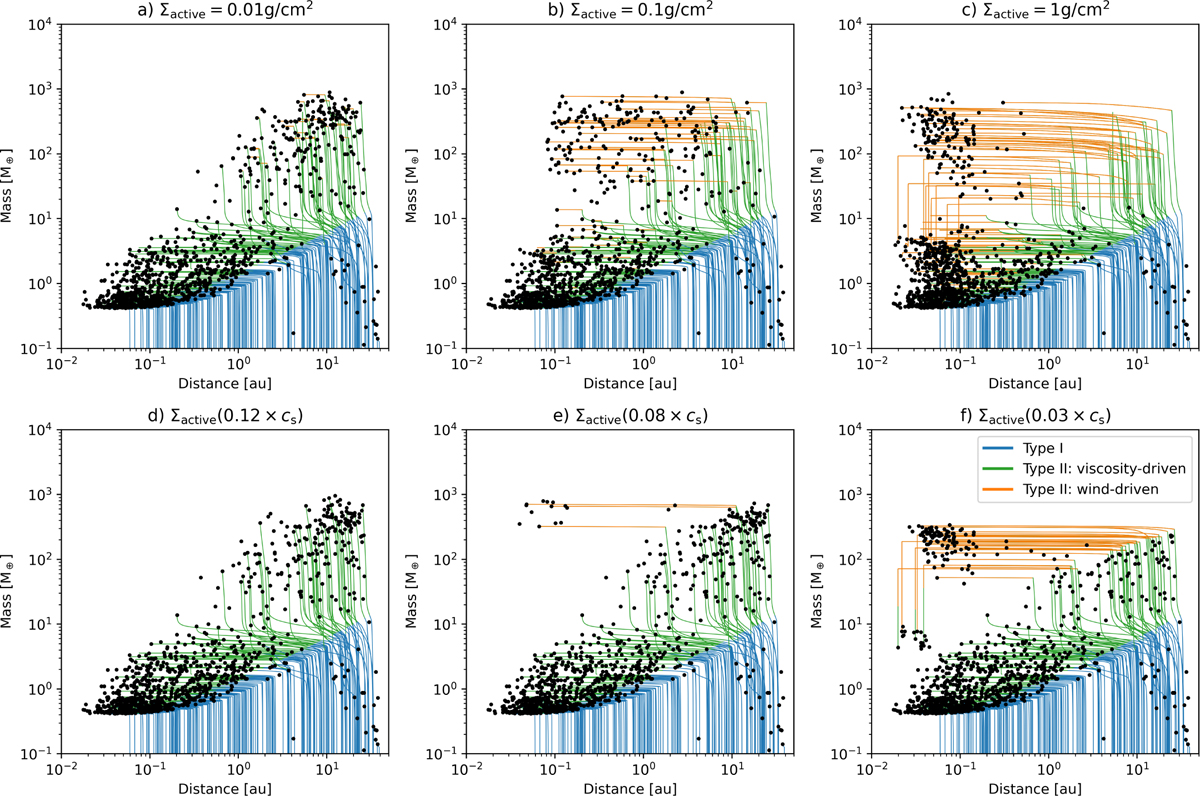
Fig. 6
Download original image
Distance–mass diagrams for single-embryo populations with varying parameterisations of Σactive. Top row shows results for temporally and spatially constant Σactive, while the bottom row shows results with the accretion velocity being a fraction of the local sound speed, fs × cs. Accretion layer thicknesses increase from left to right. Formation tracks are shown for 200 randomly selected simulations coloured by migration regime.
Current usage metrics show cumulative count of Article Views (full-text article views including HTML views, PDF and ePub downloads, according to the available data) and Abstracts Views on Vision4Press platform.
Data correspond to usage on the plateform after 2015. The current usage metrics is available 48-96 hours after online publication and is updated daily on week days.
Initial download of the metrics may take a while.