Fig. 3.
Download original image
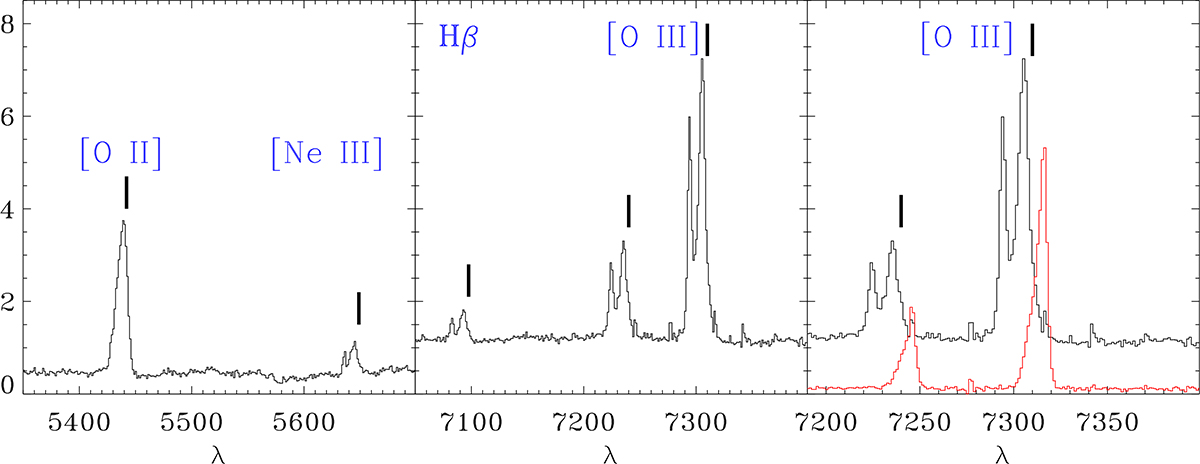
Left and center panels: Two portions of nuclear spectrum of 3C 313 extracted from a circular aperture 0![]() 6 of radius, including both nuclei. The middle panel covers the region of the Hβ and [O III] λλ4959,5007 lines: all these lines show a double-peaked profile. In the left panel, we show the spectral region including the [O II] λλ3726,3729 doublet and the [Ne III] λ3870 line. The [O II] line shows a single profile. The right panel compares the nuclear spectrum with that extracted 1
6 of radius, including both nuclei. The middle panel covers the region of the Hβ and [O III] λλ4959,5007 lines: all these lines show a double-peaked profile. In the left panel, we show the spectral region including the [O II] λλ3726,3729 doublet and the [Ne III] λ3870 line. The [O II] line shows a single profile. The right panel compares the nuclear spectrum with that extracted 1![]() 4 ENE of the northern nucleus. The thick vertical segments mark the expected wavelengths of the emission lines based on the redshift derived from the stellar emission. Both the [O II] line and the red component of [O III] have a redshift consistent within the errors with the value derived from the starlight.
4 ENE of the northern nucleus. The thick vertical segments mark the expected wavelengths of the emission lines based on the redshift derived from the stellar emission. Both the [O II] line and the red component of [O III] have a redshift consistent within the errors with the value derived from the starlight.
Current usage metrics show cumulative count of Article Views (full-text article views including HTML views, PDF and ePub downloads, according to the available data) and Abstracts Views on Vision4Press platform.
Data correspond to usage on the plateform after 2015. The current usage metrics is available 48-96 hours after online publication and is updated daily on week days.
Initial download of the metrics may take a while.