| Issue |
A&A
Volume 706, February 2026
|
|
|---|---|---|
| Article Number | A326 | |
| Number of page(s) | 9 | |
| Section | Extragalactic astronomy | |
| DOI | https://doi.org/10.1051/0004-6361/202557272 | |
| Published online | 17 February 2026 | |
The MURALES survey
VIII. Discovery of a dual active nucleus in the radio galaxy 3C 313
1
INAF – Osservatorio Astrofisico di Torino Via Osservatorio 20 I-10025 Pino Torinese, Italy
2
Instituto de Astronomía y Ciencias Planetarias, Universidad de Atacama Copayapu 485 Copiapó, Chile
3
Dipartimento di Fisica, Università degli Studi di Torino Via Pietro Giuria 1 10125 (Torino), Italy
★ Corresponding author: This email address is being protected from spambots. You need JavaScript enabled to view it.
Received:
16
September
2025
Accepted:
14
November
2025
Abstract
We present the results of VLT/MUSE integral-field spectroscopy of the radio galaxy 3C 313 at z = 0.459, combined with HST and Chandra images. The high-resolution optical and X-ray images show the presence of two sources separated by 0.″63 (3.7 kpc). The narrow emission lines produced by highly ionized gas show a double-peaked profile, with a separation corresponding to ∼400 km s−1. No permitted broad lines are observed. We conclude that 3C 313 hosts a dual active galactic nucleus (AGN), with both nuclei being optically obscured type II. The low ionization [O II] line instead has a single profile, and it was likely produced by the large scale, low-density interstellar medium. 3C 313 is the second dual AGN discovered among the 63 sources observed as part of the MURALES survey. Besides the emission associated with the two nuclei, we found a tail of line emission extending for ∼18 kpc aligned with the radio structure. We interpret this structure as a nuclear outflow of ionized gas.
Key words: galaxies: active / galaxies: nuclei
© The Authors 2026
 Open Access article, published by EDP Sciences, under the terms of the Creative Commons Attribution License (https://creativecommons.org/licenses/by/4.0), which permits unrestricted use, distribution, and reproduction in any medium, provided the original work is properly cited.
This article is published in open access under the Subscribe to Open model. This email address is being protected from spambots. You need JavaScript enabled to view it. to support open access publication.
1. Introduction
Mergers play a fundamental role in the hierarchical models of galaxy formation and evolutions: most, if not all, galaxies contain a supermassive black hole (SMBH), and the meeting of two galaxies might lead to the formation of dual black holes in-spiraling in the merging galaxy (e.g., De Rosa et al. 2019). Among other effects, mergers with a gas-rich galaxy funnel gas toward the central galactic regions (Mihos & Hernquist 1996), potentially enhancing star formation and triggering the active-galactic-nucleus (AGN) activity (e.g., Treister et al. 2012; Hopkins et al. 2014). However, other studies have reached opposite conclusions, revealing no enhanced AGN activity in mergers (e.g. Cisternas et al. 2011; Mechtley et al. 2016). The building of statistically significant sample of multiple black-hole systems over a wide range in spatial separations can shed light on the evolution and assembly of galaxies and SMBHs.
When both black holes are accreting, they shine as a AGN pair that evolves on a ∼100 Myr timescale (Begelman et al. 1980) into a dual AGN before the final coalescence. In this intermediate evolutionary stage, dual AGNs are separated by less than ∼10 kpc and, according to models, the AGN activity and star formation are the most vigorous (e.g., Van Wassenhove et al. 2012; Blecha et al. 2013). They can therefore be identified through high-resolution observations (e.g., Koss et al. 2012) or light curves showing periodic modulations (Charisi et al. 2016). Mannucci et al. (2022) obtained a large samples of dual/lensed AGN candidates with sub-arcsecond separations by looking for AGNs showing multiple peaks in the light profiles observed by the Gaia satellite. Recently, Perna et al. (2025) observed a sample of galaxies with NIRspec on board the JWST and reported the discovery of several multiple AGN candidates at z ∼ 3 with projected separations below ∼30 kpc. A large number of dual AGN candidates were selected using large spectroscopic sky surveys searching for signatures of two distinct narrow-line regions, moving with relative velocity on the order of several hundred km s−1 (e.g., Müller-Sánchez et al. 2015; Smith et al. 2010; Wang et al. 2009). However, this method is plagued by the possibility of the presence of intrinsic multiple-velocity gas systems in a single AGN.
Hundreds of AGN pairs with > 10 kpc separations have been discovered so far. However, due to observational difficulties, there are only a few confirmed < 10 kiloparsec-scale dual AGNs (see De Rosa et al. 2019; Lu 2025 for a review), and despite efforts in recent decades, they turned out to be elusive objects (e.g., Koss et al. 2012; Rosario et al. 2011; Fu et al. 2011). This is likely, in part, because AGNs in galaxy mergers are likely more obscured than those in isolated galaxies (Kocevski et al. 2015; Koss et al. 2016; Ricci et al. 2017; Satyapal et al. 2017). In the mid-infrared, dust extinction is attenuated, and the selection of candidates using mid-IR colors from the Wide Field Infrared Survey Explorer (WISE) improves the success rate for dual AGN confirmation (Satyapal et al. 2017; Ellison et al. 2017).
When the two black holes reach a parsec distance, they form a binary system, a source of low-frequency gravitational waves that the Laser Interferometer Space Antenna (LISA) (Amaro-Seoane et al. 2017) will be able to detect in the near future. In the radio band it is possible to resolve binary AGNs at a sub-milliarcsecond distance. All the binary black holes separated by less than 10 parsec have been confirmed with high-resolution radio observations (e.g., Rodriguez et al. 2006; Gabányi et al. 2016; Kharb et al. 2017). Long-term monitoring programs of AGNs with the VLBI, such as the Monitoring Of Jets in Active galactic nuclei with VLBA Experiments (MOJAVE) project, are investigating the kinematics of the radio jets on a parsec scale. Many AGN jets undergo significant changes in the jet-projected direction (Lister et al. 2013), and in some cases they show evidence of long-term precession (Alexander 1985; Steenbrugge et al. 2008) possibly caused by a companion. However, a non-detection in the radio band does not exclude the presence of dual AGNs, since only ∼10% of the nuclei are radio loud.
Radio galaxies are ideal sources for a search of a dual/binary AGNs. In fact, a major merger between two galaxies of similar masses (∼1010 − 1011 M⊙; e.g., Best et al. 2005) might produce a highly spinning black hole from which the energy to launch relativistic jets can be extracted (Blandford & Znajek 1977; Chiaberge & Marconi 2011). At high redshift (z > 1), almost all radio galaxies are associated with recent or ongoing merger events (Chiaberge et al. 2015). In addition, in one such object, 3C 186, (Chiaberge et al. 2017) found a large spatial and velocity offset between the AGN and the host galaxy (Morishita et al. 2022; Castignani et al. 2022) consistent with those expected if this is associated with a recoiling BH, which can reach a velocity of hundreds of km s−1 (Boschini et al. 2024) resulting from the coalescence of black holes in the late phases of a merger. Furthermore, there is some evidence that mergers also play a major role in radio-loud objects at lower redshift (e.g., Capetti & Balmaverde 2006; Baldi & Capetti 2008; Ramos Almeida et al. 2011, 2012). For example, 3C 75 and Abell 439, are both associated with pairs of galaxies separated by ∼10–20 kpc both producing an extended radio source (Owen et al. 1985; O’Dea & Owen 1985). There have also been various claims of binary BHs in 3C sources based on the modeling of the parsec-scale radio structure in these sources in which only one black hole is active (De Paolis et al. 2004; Lobanov & Roland 2005; Roland et al. 2013; Romero et al. 2000). The best evidence, however, was obtained from the observations of 0402+379, a binary system with a separation of 7.3 pc (Bansal et al. 2017) and NGC7675, which is to date the closest AGN couple at a projected distance of 0.35 parsec (Kharb et al. 2017). Finally, no dual AGN are found in the Chandra observations of the low z 3C sample (Massaro et al. 2010, 2012, 2015), but most of these observations were taken with a short exposure time (8 ks).
As part of the MUse RAdio Loud Emission line Snapshot (MURALES) survey, we observed 63 radio galaxies with the Multi Unit Spectroscopic Explorer (MUSE) at the VLT. The sample is formed by all the 3C radio sources (Spinrad et al. 1985) with z < 0.82 and δ < 20°, with the exception of only three sources not observed due to scheduling constraints. The main results of MURALES are presented in Balmaverde et al. (2019, 2021) and Capetti et al. (2023). The aim of this survey is obtain deep line-emission images and explore the gas kinematics and its relationship with the relativistic outflows. However, the sensitivity of MUSE combined with its high spatial and spectral resolution also make this instrument a powerful tool for discovering AGN pairs. In Balmaverde et al. (2018), we reported the discovery of a candidate dual AGN in the 3C 459 at z = 0.220, with the two nuclei separated by 5.3 kpc.
In this paper, we report the discovery of a dual AGN in 3C 313, a radio galaxy at z = 0.459 (where 1″ corresponds to ∼5.9 kpc). 3C 313 is a member of a galaxy cluster (Hill & Lilly 1991; Stanford et al. 2002) that is also listed in the catalog of Wen et al. (2012) based on the Sloan Digital Sky Survey (SDSS). The stellar velocity dispersion measured from the SDSS spectrum is 289 ± 40 km s−1. In the optical spectrum it shows only narrow emission lines with line ratios characteristic of a high-excitation galaxy (HEG; Capetti et al. 2023).
We adopted the following set of cosmological parameters: H0 = 69.7 km s−1 Mpc−1 and Ωm = 0.286 (Bennett et al. 2014).
2. The HST, Chandra, and MUSE observations.
3C 313 is a very luminous (L178 MHz = 1.2 × 1028 W Hz−1) FR II radio source with prominent host spots; it is 130″ (780 kpc) in size and oriented at PA = 60°. We identified the host galaxy based on the position of the radio nucleus, which is clearly visible in the image of the Karl G. Jansky Very Large Array Sky Survey (VLASS, Lacy et al. 2020) shown in Fig. 1 and located at RA = 15:11:00.03, Dec = +07:51:50.21.
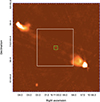 |
Fig. 1. VLASS image of 3C 313. The white square shows the MUSE field of view of 1′×1′, while the green square (6″ × 6″ in size) shows the region where emission lines are detected and where the radio nucleus is located. The image is oriented with north to the top and east to the left. |
The HST observations of 3C 313 were obtained as part of program ID5476 (PI: W.B. Sparks) on January 22th, 1995 with the Wide Field Planetary Camera 2. A single exposure of 300 s was taken with the wide filter F702W, which covers the wavelength range of ∼6000 − 8200 Å. We retrieved the reduced image from the archive and manually removed the cosmic rays in the region of interest.
The 2 5 × 2
5 × 2 5 central region of the HST image is presented in Fig. 2, left panel. It shows two peaks of emission separated by
  , 3.7 kpc at the redshift of 3C 313. The northern component is compact but well resolved, while the southern component is more diffuse. We refer to these two structures as the northern and the southern nucleus (NN and SN, respectively). Both nuclei are embedded in extended diffuse emission.
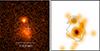 |
Fig. 2. Left: HST image of 3C 313 obtained with Wide Field Planetary Camera 2 with the wide filter F702W. The field of view is 2 |


The F702W filter includes several emission lines at the redshift of 3C 313, namely Hβ, and [O III] λλ4959, 5007. We estimated the relative contribution of the stellar continuum and emission lines extracting the MUSE spectrum from the same region. We convolved this spectrum with the transmission curve of the F702W filter and estimated that the emission lines contribute to less than ∼5% to the total light. The HST image is, therefore, dominated by the stellar continuum.
We corrected the astrometry of the HST image by measuring the offset of several stars in the field of view of the Planetary Camera with respect to their positions in the catalog of the Panoramic Survey Telescope & Rapid Response System (Pan-STARRS, Chambers & Pan-STARRS Team 2016). With this correction, we were able to locate the radio core with respect to the HST images: the core is located closer to the SN, but it is offset by less than ∼2σ from the NN. Thus, we cannot identify which is the radio-loud nucleus producing the large-scale radio structure.
The Chandra observations were obtained with the ACIS-S instruments on May 7th, 2012 with an exposure time of 12 ks in very faint mode as part of the program ID 13700190 (PI F. Massaro). The Chandra image of 3C 313 was already presented in Massaro et al. (2011) and Massaro et al. (2013), and it shows a nuclear source and X-ray emission along the radio axis as well as associated with the radio hotspots. The data reduction was performed following the standard reduction procedure described in the Chandra Interactive Analysis of Observations (CIAO) threads, 7 using CIAO v4.4 and the Chandra Calibration Database version 4.5.3. Because we are interested in the innermost regions of this source we produced a sub-pixel image in the 3–10 keV energy band regridding the data to one-tenth of the native ACIS pixel size, following the strategy of Harris et al. (2011). The resulting image was then smoothed with a Gaussian filter with a two-pixel FWHM. The resulting image (see Fig. 2, right panel) shows two sources at the same separation and orientation of the two nuclei seen in the HST image. No spectral analysis is possible due to the very limited statistics (only 3 and 8 events are present associated with NN and SN, respectively), but the lack of photons with energies below 3 keV indicates that both AGNs are strongly affected by strong obscuration.
The MUSE observations were obtained on March 12th, 2022 with a seeing of  . MUSE has a field of view of 1′×1′ and a pixel size of 0
 2 × 0
2 × 0 2; the wavelength range covers from 4650–9300 Å in the extended mode at a resolution of ∼3000 at 7500 Å (Weilbacher et al. 2020). We used the ESO MUSE pipeline (version 1.6.2) to obtain a fully reduced and calibrated data cube.
We measured the redshift of the host galaxy of 3C 313 by fitting the nuclear spectrum, which was extracted from a synthetic circular aperture with radius of 0 6, with the ppxf code (Cappellari 2017). The resulting value, based on the presence of several stellar absorption features, is z = 0.4600 ± 0.0005.
The emission lines at the nucleus (see Fig. 3) show a double-peaked profile with a separation of ∼400km s−1 for all lines except for [O II], which is instead characterized by a single emitting component. No broad component is visible in the Hβ line.
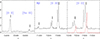 |
Fig. 3. Left and center panels: Two portions of nuclear spectrum of 3C 313 extracted from a circular aperture 0 |


We simultaneously fit all emission lines in the nuclear spectrum with two Gaussian components (see Table 1 for a summary of the fitting results), except for the [O II] line. The highly ionized gas at the NN shows a small velocity offset with respect to the stars (v = −117 km s−1) and broader emission lines (FWHM = 334km s−1) than at the SN (FWHM = 200km s−1), which is instead more blueshifted (v = −516 km s−1). The observed wavelength of the [O II] line (assuming that the two components of the doublet have the same flux) corresponds to a redshift of z = 0.4593 ± 0.0003. Both the [O II] line and the red component of [O III] have a redshift consistent within the errors with the value derived from the starlight.
Emission-line properties.
We then extracted the spectrum of each spatial pixel and fit all emission lines present in the spectrum. From this procedure, we derived the surface-brightness distributions of emission lines as well as their velocities and velocity dispersions. The fit was limited to the pixels where the emission lines have an S/N larger than 3. In Fig. 4, we present the results obtained for the [O II] line. Most of the emission is produced by a compact nuclear region, but a bright tail of emission is seen to the ENE of the double nucleus, extending for ∼3″ (∼18 kpc). No emission above the detection limit is seen at any other location in the field of view.
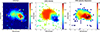 |
Fig. 4. Results of pixel-by-pixel emission-line fitting. In the left panel we show the flux distribution of the [O II] doublet in units of 10−18 erg s−1 arcsec−2; the two crosses mark the location of the peak of emission in the red and blue components; i.e., of the two active nuclei. In the central panel we present the gas velocity, and in the right panel we show its velocity dispersion, both in km s−1 units. |
The gas velocity has its lowest value slightly south-west of the NS, at the same location where the blue component of the [O III] reaches its peak; then, it gradually increases moving toward the north east. Over an extended region on the east side of the NN (hereafter, the NE tail), velocities are instead positive, reaching ∼200km s−1 for the [O II] and ∼ 300 km s−1 for the [O III]. The gas velocity dispersion reaches its maximum (∼ 300 km s−1) where the two nuclei are located and smoothly decreases down to ∼ 200 km s−1, along the NE tail where it remains, however, well above the MUSE instrumental resolution.
To explore the emission-line structure in the nuclear region in more detail, we considered the results obtained by separating the contribution of the two [O III] components associated with the two nuclei. The width and velocity of the two lines are effectively constant across the central 1″ × 1″, as expected in the case where the two [O III] emission regions are unresolved. In Fig. 5, we show the surface brightness of the of the two components separately. There is a spatial offset of ∼3 pixels (∼0 6) between the peak of the red and blue [O III] components, the blue one being shifted toward the south, a separation consistent with that seen in the stellar and X-ray nuclei.
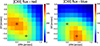 |
Fig. 5. Results of pixel-by-pixel emission-line fitting for the nuclear region. In the left panel, we show the flux distribution of the red component of the [O III], while in the right panel we show the emission of the blue component. Both images have been smoothed with a Gaussian filter with a FWHM of one pixel. The two crosses mark the location of the peak of emission in the red and blue components. |
The relative intensities of the various lines in the two nuclei are similar (see Table 2). We used the diagnostic diagrams based on UV and blue emission lines (Capetti et al. 2023) to classify the two AGN: in particular, the high [O III]/Hβ ratios (11.9 and 14.8 for the NN and NS, respectively) are typical of HEGs. Because the contribution of the [O II] emission cannot be separated between the two nuclei, we estimated the line ratios for the whole nuclear region, finding support in all diagrams for an identification as an HEG.
Outflow parameters.
In addition to the emission from the nuclear region, the MUSE data show that ionized gas is also present in a structure that extends for ∼18 kpc to the NE. This NE tail is elongated along PA ∼60°, very close to the orientation of the large-scale radio structure (PA = 59°, Baum & Heckman 1989). It covers an angular extent of ∼45°. Most importantly, the gas in the tail has a large velocity offset with respect to both nuclei. In the NE tail, the emission-line ratio is 14.1, a value more similar to that measured for the NS than for the NN. Considering that this region does not have any correspondence in HST or Chandra images, this suggests that the tail is composed of gas that was likely photoionized by the NS.
We interpret this feature as a wide-angle nuclear outflow. Based on the available information, we cannot establish from which of the two nuclei the outflow originates.
The line ratios in this region are similar to those measured in the two nuclei, indicating that the line emission is also produced by nuclear photoionization. We estimated the mass of the outflow using the relation discussed by Osterbrock (1989),  and the kinetic energy of nuclear outflows as
  , where ne is the electron density and LHβ is the luminosity of the Hβ line. The electron density is commonly measured from the emission-line ratio [S II] λ6716/λ6731 (e.g., Osterbrock 1989) but these lines are not covered by the MUSE spectra. Following Fiore et al. (2017), we adopted an average gas density of ⟨ne⟩ = 200 cm−3. With this assumption, we derived outflow parameters comparable with those obtained by Fiore et al. 2017 for their collection of AGNs and with those derived by Speranza et al. (2021) for radio galaxies.
We estimated the total mass and total energy carried by the outflow summing the values in all the significant pixels (i.e. with S/N > 3) as in Speranza et al. (2021). We estimated the velocity and its extension, Rof, defined as the largest distance at which the line surface brightness exceeds the 3σ level with respect to each of the nuclei. We then estimated the mass-outflow rate (Ṁof), the energy rate (Ėof), and the outflow momentum boost (Ṗof):

Depending on the assumption on the origin of the outflow, NN or NS, there are two references for both the velocity and the distance. We obtained the following two sets of parameters.
These values can be compared with the results obtained by Speranza et al. (2021) for the spatially resolved outflow observed in the MURALES targets at z < 0.3. To draw this comparison, we need to estimate the bolometric luminosity and the jet power of 3C 313. We derived the bolometric luminosity of the two nuclei from the [O III] luminosity, adopting the correction factor proposed by Shao et al. (2013), that is, Lbol = 600 × L[O III] obtaining Lbol = 2.6 × 1044 erg s−1 and Lbol = 1.3 × 1044 erg s−1 for NN and NS, respectively. These values are both well within the range of bolometric luminosity of the HEGs in the sample of Speranza et al. (2021). We then adopted the relation described by Daly et al. (2012) to estimate the jet power from the low-frequency radio power: log Pjet = 0.84 × log P178 + 2.15, with both quantities in units of 1044 erg s−1. The radio power P178 was derived from the radio luminosity density at 178 MHz quoted in the introduction (P178 = ν × L178 = 2.2 × 1043 erg s−1) from which we estimate a jet power of log Pjet = 45.60.
We compared our estimates with the results obtained by Speranza et al. (2021), analyzing a sample of 3C radio galaxies of different types (HEGs, LEGs, BLOs). We noted that HEGs with similar levels of bolometric luminosity have outflow kinetic power and masses of ionized gas in the same range of values (Ekin ∼ 1055 erg and Mof ∼1 − 10 M⊙), which is in line with the measurements for HEGs. The comparison between the jet and the outflow kinetic power for both nuclei with respect to other HEGs and BLOs studied by Speranza et al. (2021) shows a large deficit (by 2–3 orders of magnitude) with respect to sources of similar jet power, further increasing the already large spread of the connection between these two parameters. Therefore, we speculate that the outflow is likely accelerated by the radiation released by the accretion process and not powered by the radio jet, as we already suggested to be the case in general for HEGs and BLOs.
However, the motion of the gas is complex, and we cannot rule out different scenarios. One alternative possibility is that this redshifted structure is a tidal stream of gas, residual of a close encounter with the companion galaxy hosting the SN nucleus. Another possibility is that the gas disks of the radio galaxies have been disturbed by the motion of the two binary black holes.
3. Discussion
The HST, Chandra, and MUSE data provide us with a consistent picture that the galaxy associated with the radio source 3C 313 hosts a dual AGN. The differences in the line profiles between the two nuclei rules out the interpretation of a lensed AGN. The spectra in the nuclear regions do not show the presence of a broad Hβ line, indicating that both nuclei are type II sources, in which the optical nuclear emission is hidden from our view by the circumnuclear medium. This is confirmed by the Chandra observations in which the emission of both nuclei is dominated by high energy (> 3 keV) photons. Although the jets are not visible in the VLASS image, the radio structure is apparently not disturbed by the presence of the secondary black hole.
All emission lines in the nuclear region present a double-peaked profile, with a separation of ∼400km s−1, with the only exception of the [O II] line. The NLR in an AGN is known to be highly stratified both in ionization and in density (Veilleux 1991; Balmaverde & Capetti 2014). We can envisage that the double-line profiles are due to the presence of regions of dense and highly ionized gas, mainly produced in the close vicinity of each of the two nuclei and following the motions of the two SMBHs in the galaxy’s gravitation potential. Conversely, the [O II] line is emitted by a transition of, at the same time, lower energy and lower critical density. For this reason, it is produced at larger distances from the AGN and in regions of lower density. It is likely to originate mainly from the large-scale distribution of gas within the host galaxy. This idea is also supported by the velocity measured for this emission line that is consistent with that obtained from the stellar emission.
3C 313 is the second dual AGN, together with 3C 459, that we discovered with the MURALES survey, but the census of such objects is clearly highly incomplete. The discovery of dual AGN when one or both nuclei are type II sources, obscured in the optical and X-ray bands, is particularly challenging. This effect is certainly important considering that more than half of the z < 0.5 radio galaxies belong to this class. In addition, when one of the AGN pairs is instead a type I source, its nuclear emission might hide the second AGN when this is a type II object, as in the case of 3C 459. Visual inspection of the HST images (limited to the sources with z < 0.5, see de Koff et al. 1996; Martel et al. 1999) of the MURALES targets reveal the presence of structures that might be related to a dual AGN only in two cases, namely 3C 079 and 3C 287.1, but none of them showing evidence in the MUSE data for a double active nucleus. The HST and Chandra images can resolve a dual AGN only when they are located at an angular separation of  for HST and ≳1″ for Chandra, corresponding to z = 0.1 to 0.2 and 2 kpc, respectively: closer dual AGNs cannot be separated. Optical spectroscopy can in principle overcome this limitation because the double emission line system can be revealed even when they are not spatially resolved. However, no such system was found by the MURALES survey. Nonetheless it is likely that more dual AGN in nearby radio galaxies are present, but they remained undiscovered.
In addition to nuclear emission, a tail of the emission line extends to the north-east for ∼18 kpc. We interpret this structure as the manifestation of a broad-angle nuclear outflow of ionized gas. We estimated the parameters describing this outflow finding a good agreement with those observed at lower redshift based on their relation with the bolometric luminosity, but not considering the jet power. This suggests that the outflow is accelerated by radiation pressure and not by the radio jet. This structure of ionized gas might also not be an outflow but a stream of gas left behind by the nuclei due to their motion within the galaxy or a leftover of a merger.
Acknowledgments
We thank the anonymous referee for the useful comments that improved the paper. The MUSE images have been produced from observations collected at the European Southern Observatory under ESO programme ID 0106.B-0564(A). In this work we used observations made with the NASA/ESA Hubble Space Telescope obtained from the Space Telescope Science Institute, which is operated by the Association of Universities for Research in Astronomy, Inc., under NASA contract NAS 526555; the observation is associated with the program SNAP 5476. The X-ray data are from the Chandra Data Archive provided by the Chandra X-ray Center (CXC), Obs Id 13886. For the radio map we acknowledge the National Radio Astronomy Observatory, a facility of the National Science Foundation operated under cooperative agreement by Associated Universities, Inc. CIRADA is funded by a grant from the Canada Foundation for Innovation 2017 Innovation Fund (Project 35999), as well as by the Provinces of Ontario, British Columbia, Alberta, Manitoba and Quebec. For the astrometric correction we used the Pan-STARRS1 Surveys (PS1) and the PS1 public science archive. This research has made use of NASA Astrophysics Data System; SAOImage DS9, developed by the Smithsonian Astrophysical Observatory; and the NASA/IPAC Extragalactic Database (NED), which is operated by the Jet Propulsion Laboratory, California Institute of Technology, under contract with the National Aeronautics and Space Administration. BB acknowledges the PRIN INAF 2023 “The MURALES project: exploring AGN feedback in the most powerful radio loud active galactic nuclei”. Facilities: VLT:MUSE, HST, Chandra.
References
- Alexander, P. 1985, MNRAS, 213, 743 [Google Scholar]
- Amaro-Seoane, P., Audley, H., Babak, S., et al. 2017, ArXiv e-prints [arXiv:1702.00786] [Google Scholar]
- Baldi, R. D., & Capetti, A. 2008, A&A, 489, 989 [NASA ADS] [CrossRef] [EDP Sciences] [Google Scholar]
- Balmaverde, B., & Capetti, A. 2014, A&A, 563, A119 [NASA ADS] [CrossRef] [EDP Sciences] [Google Scholar]
- Balmaverde, B., Capetti, A., Marconi, A., et al. 2018, A&A, 619, A83 [NASA ADS] [CrossRef] [EDP Sciences] [Google Scholar]
- Balmaverde, B., Capetti, A., Marconi, A., et al. 2019, A&A, 632, A124 [NASA ADS] [CrossRef] [EDP Sciences] [Google Scholar]
- Balmaverde, B., Capetti, A., Marconi, A., et al. 2021, A&A, 645, A12 [EDP Sciences] [Google Scholar]
- Bansal, K., Taylor, G. B., Peck, A. B., Zavala, R. T., & Romani, R. W. 2017, ApJ, 843, 14 [NASA ADS] [CrossRef] [Google Scholar]
- Baum, S. A., & Heckman, T. 1989, ApJ, 336, 702 [NASA ADS] [CrossRef] [Google Scholar]
- Begelman, M. C., Blandford, R. D., & Rees, M. J. 1980, Nature, 287, 307 [Google Scholar]
- Bennett, C. L., Larson, D., Weiland, J. L., & Hinshaw, G. 2014, ApJ, 794, 135 [Google Scholar]
- Best, P. N., Kauffmann, G., Heckman, T. M., et al. 2005, MNRAS, 362, 25 [Google Scholar]
- Blandford, R. D., & Znajek, R. L. 1977, MNRAS, 179, 433 [NASA ADS] [CrossRef] [Google Scholar]
- Blecha, L., Loeb, A., & Narayan, R. 2013, MNRAS, 429, 2594 [Google Scholar]
- Boschini, M., Gerosa, D., Salafia, O. S., & Dotti, M. 2024, A&A, 686, A245 [NASA ADS] [CrossRef] [EDP Sciences] [Google Scholar]
- Capetti, A., & Balmaverde, B. 2006, A&A, 453, 27 [NASA ADS] [CrossRef] [EDP Sciences] [Google Scholar]
- Capetti, A., Balmaverde, B., Baldi, R. D., et al. 2023, A&A, 671, A32 [NASA ADS] [CrossRef] [EDP Sciences] [Google Scholar]
- Cappellari, M. 2017, MNRAS, 466, 798 [Google Scholar]
- Castignani, G., Meyer, E., Chiaberge, M., et al. 2022, A&A, 661, L2 [NASA ADS] [CrossRef] [EDP Sciences] [Google Scholar]
- Chambers, K. C., & Pan-STARRS Team. 2016, Am. Astron. Soc. Meet. Abstr., 227, 324.07 [NASA ADS] [Google Scholar]
- Charisi, M., Bartos, I., Haiman, Z., et al. 2016, MNRAS, 463, 2145 [Google Scholar]
- Chiaberge, M., & Marconi, A. 2011, MNRAS, 416, 917 [Google Scholar]
- Chiaberge, M., Gilli, R., Lotz, J. M., & Norman, C. 2015, ApJ, 806, 147 [NASA ADS] [CrossRef] [Google Scholar]
- Chiaberge, M., Ely, J. C., Meyer, E. T., et al. 2017, A&A, 600, A57 [NASA ADS] [CrossRef] [EDP Sciences] [Google Scholar]
- Cisternas, M., Jahnke, K., Inskip, K. J., et al. 2011, ApJ, 726, 57 [NASA ADS] [CrossRef] [Google Scholar]
- Daly, R. A., Sprinkle, T. B., O’Dea, C. P., Kharb, P., & Baum, S. A. 2012, MNRAS, 423, 2498 [NASA ADS] [CrossRef] [Google Scholar]
- de Koff, S., Baum, S. A., Sparks, W. B., et al. 1996, ApJS, 107, 621 [NASA ADS] [CrossRef] [Google Scholar]
- De Paolis, F., Ingrosso, G., & Nucita, A. A. 2004, A&A, 426, 379 [NASA ADS] [CrossRef] [EDP Sciences] [Google Scholar]
- De Rosa, A., Vignali, C., Bogdanović, T., et al. 2019, New Astron. Rev., 86, 101525 [Google Scholar]
- Ellison, S. L., Secrest, N. J., Mendel, J. T., Satyapal, S., & Simard, L. 2017, MNRAS, 470, L49 [NASA ADS] [CrossRef] [Google Scholar]
- Fiore, F., Feruglio, C., Shankar, F., et al. 2017, A&A, 601, A143 [NASA ADS] [CrossRef] [EDP Sciences] [Google Scholar]
- Fu, H., Myers, A. D., Djorgovski, S. G., & Yan, L. 2011, ApJ, 733, 103 [Google Scholar]
- Gabányi, K. É., An, T., Frey, S., et al. 2016, ApJ, 826, 106 [CrossRef] [Google Scholar]
- Harris, D. E., Massaro, F., Cheung, C. C., et al. 2011, ApJ, 743, 177 [Google Scholar]
- Hill, G. J., & Lilly, S. J. 1991, ApJ, 367, 1 [NASA ADS] [CrossRef] [Google Scholar]
- Hopkins, P. F., Kereš, D., Oñorbe, J., et al. 2014, MNRAS, 445, 581 [NASA ADS] [CrossRef] [Google Scholar]
- Kharb, P., Lal, D. V., & Merritt, D. 2017, Nat. Astron., 1, 727 [Google Scholar]
- Kocevski, D. D., Brightman, M., Nandra, K., et al. 2015, ApJ, 814, 104 [Google Scholar]
- Koss, M., Mushotzky, R., Treister, E., et al. 2012, ApJ, 746, L22 [Google Scholar]
- Koss, M. J., Glidden, A., Baloković, M., et al. 2016, ApJ, 824, L4 [NASA ADS] [CrossRef] [Google Scholar]
- Lacy, M., Baum, S. A., Chandler, C. J., et al. 2020, PASP, 132, 035001 [Google Scholar]
- Lister, M. L., Aller, M. F., Aller, H. D., et al. 2013, AJ, 146, 120 [Google Scholar]
- Lobanov, A. P., & Roland, J. 2005, A&A, 431, 831 [NASA ADS] [CrossRef] [EDP Sciences] [Google Scholar]
- Lu, Y. 2025, CQG, 42, 113001 [Google Scholar]
- Mannucci, F., Pancino, E., Belfiore, F., et al. 2022, Nat. Astron., 6, 1185 [NASA ADS] [CrossRef] [Google Scholar]
- Martel, A. R., Baum, S. A., Sparks, W. B., et al. 1999, ApJS, 122, 81 [NASA ADS] [CrossRef] [Google Scholar]
- Massaro, F., Harris, D. E., Tremblay, G. R., et al. 2010, ApJ, 714, 589 [Google Scholar]
- Massaro, F., D’Abrusco, R., Ajello, M., Grindlay, J. E., & Smith, H. A. 2011, ApJ, 740, L48 [NASA ADS] [CrossRef] [Google Scholar]
- Massaro, F., D’Abrusco, R., Tosti, G., et al. 2012, ApJ, 750, 138 [NASA ADS] [CrossRef] [Google Scholar]
- Massaro, F., Harris, D. E., Tremblay, G. R., et al. 2013, ApJS, 206, 7 [Google Scholar]
- Massaro, F., Harris, D. E., Liuzzo, E., et al. 2015, ApJS, 220, 5 [Google Scholar]
- Mechtley, M., Jahnke, K., Windhorst, R. A., et al. 2016, ApJ, 830, 156 [NASA ADS] [CrossRef] [Google Scholar]
- Mihos, J. C., & Hernquist, L. 1996, ApJ, 464, 641 [Google Scholar]
- Morishita, T., Chiaberge, M., Hilbert, B., et al. 2022, ApJ, 931, 165 [NASA ADS] [CrossRef] [Google Scholar]
- Müller-Sánchez, F., Comerford, J. M., Nevin, R., et al. 2015, ApJ, 813, 103 [Google Scholar]
- O’Dea, C. P., & Owen, F. N. 1985, AJ, 90, 927 [Google Scholar]
- Osterbrock, D. E. 1989, Astrophysics of Gaseous Nebulae and Active Galactic Nuclei [Google Scholar]
- Owen, F. N., O’Dea, C. P., Inoue, M., & Eilek, J. A. 1985, ApJ, 294, L85 [NASA ADS] [CrossRef] [Google Scholar]
- Perna, M., Arribas, S., Lamperti, I., et al. 2025, A&A, 696, A59 [NASA ADS] [CrossRef] [EDP Sciences] [Google Scholar]
- Ramos Almeida, C., Tadhunter, C. N., Inskip, K. J., et al. 2011, MNRAS, 410, 1550 [NASA ADS] [Google Scholar]
- Ramos Almeida, C., Bessiere, P. S., Tadhunter, C. N., et al. 2012, MNRAS, 419, 687 [NASA ADS] [CrossRef] [Google Scholar]
- Ricci, C., Bauer, F. E., Treister, E., et al. 2017, MNRAS, 468, 1273 [NASA ADS] [Google Scholar]
- Rodriguez, C., Taylor, G. B., Zavala, R. T., et al. 2006, ApJ, 646, 49 [Google Scholar]
- Roland, J., Britzen, S., Caproni, A., et al. 2013, A&A, 557, A85 [NASA ADS] [CrossRef] [EDP Sciences] [Google Scholar]
- Romero, G. E., Chajet, L., Abraham, Z., & Fan, J. H. 2000, A&A, 360, 57 [NASA ADS] [Google Scholar]
- Rosario, D. J., McGurk, R. C., Max, C. E., et al. 2011, ApJ, 739, 44 [NASA ADS] [CrossRef] [Google Scholar]
- Satyapal, S., Secrest, N. J., Ricci, C., et al. 2017, ApJ, 848, 126 [Google Scholar]
- Shao, L., Kauffmann, G., Li, C., Wang, J., & Heckman, T. M. 2013, MNRAS, 436, 3451 [CrossRef] [Google Scholar]
- Smith, K. L., Shields, G. A., Bonning, E. W., et al. 2010, ApJ, 716, 866 [Google Scholar]
- Speranza, G., Balmaverde, B., Capetti, A., et al. 2021, A&A, 653, A150 [NASA ADS] [CrossRef] [EDP Sciences] [Google Scholar]
- Spinrad, H., Marr, J., Aguilar, L., & Djorgovski, S. 1985, PASP, 97, 932 [CrossRef] [Google Scholar]
- Stanford, S. A., Eisenhardt, P. R., Dickinson, M., Holden, B. P., & De Propris, R. 2002, ApJS, 142, 153 [Google Scholar]
- Steenbrugge, K. C., Blundell, K. M., & Duffy, P. 2008, MNRAS, 388, 1465 [CrossRef] [Google Scholar]
- Treister, E., Schawinski, K., Urry, C. M., & Simmons, B. D. 2012, ApJ, 758, L39 [NASA ADS] [CrossRef] [Google Scholar]
- Van Wassenhove, S., Volonteri, M., Mayer, L., et al. 2012, ApJ, 748, L7 [Google Scholar]
- Veilleux, S. 1991, ApJ, 369, 331 [Google Scholar]
- Wang, J.-M., Chen, Y.-M., Hu, C., et al. 2009, ApJ, 705, L76 [Google Scholar]
- Weilbacher, P. M., Palsa, R., Streicher, O., et al. 2020, A&A, 641, A28 [NASA ADS] [CrossRef] [EDP Sciences] [Google Scholar]
- Wen, Z. L., Han, J. L., & Liu, F. S. 2012, ApJS, 199, 34 [Google Scholar]
The HST image shown in de Koff et al. (1996) is not centered at the correct location.
Appendix A: Spectral decomposition.
In this Section we present the results of the spectral decomposition of the spectrum on the nucleus (Fig. A.1) and on the off-nuclear region (Fig. A.2). The top panels show the spectral region including the [O III] and Hβ lines, the bottom panels show the spectral region including the [Ne V], [O II], and [Ne III] lines.
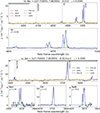 |
Fig. A.1. Spectral decomposition of the spectrum on the nucleus. The top panels show the spectral region including the [O III] and Hβ lines, the bottom panels show the spectral region including the [Ne V], [O II], and [Ne III] lines. |
All Tables
All Figures
|
Fig. 1. VLASS image of 3C 313. The white square shows the MUSE field of view of 1′×1′, while the green square (6″ × 6″ in size) shows the region where emission lines are detected and where the radio nucleus is located. The image is oriented with north to the top and east to the left. |
| In the text | |
|
Fig. 2. Left: HST image of 3C 313 obtained with Wide Field Planetary Camera 2 with the wide filter F702W. The field of view is 2 |
| In the text | |
|
Fig. 3. Left and center panels: Two portions of nuclear spectrum of 3C 313 extracted from a circular aperture 0 |
| In the text | |
|
Fig. 4. Results of pixel-by-pixel emission-line fitting. In the left panel we show the flux distribution of the [O II] doublet in units of 10−18 erg s−1 arcsec−2; the two crosses mark the location of the peak of emission in the red and blue components; i.e., of the two active nuclei. In the central panel we present the gas velocity, and in the right panel we show its velocity dispersion, both in km s−1 units. |
| In the text | |
|
Fig. 5. Results of pixel-by-pixel emission-line fitting for the nuclear region. In the left panel, we show the flux distribution of the red component of the [O III], while in the right panel we show the emission of the blue component. Both images have been smoothed with a Gaussian filter with a FWHM of one pixel. The two crosses mark the location of the peak of emission in the red and blue components. |
| In the text | |
|
Fig. A.1. Spectral decomposition of the spectrum on the nucleus. The top panels show the spectral region including the [O III] and Hβ lines, the bottom panels show the spectral region including the [Ne V], [O II], and [Ne III] lines. |
| In the text | |
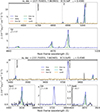 |
Fig. A.2. Same as for Fig. A.1 but for the off-nuclear region. |
| In the text | |
Current usage metrics show cumulative count of Article Views (full-text article views including HTML views, PDF and ePub downloads, according to the available data) and Abstracts Views on Vision4Press platform.
Data correspond to usage on the plateform after 2015. The current usage metrics is available 48-96 hours after online publication and is updated daily on week days.
Initial download of the metrics may take a while.