Fig. 4.
Download original image
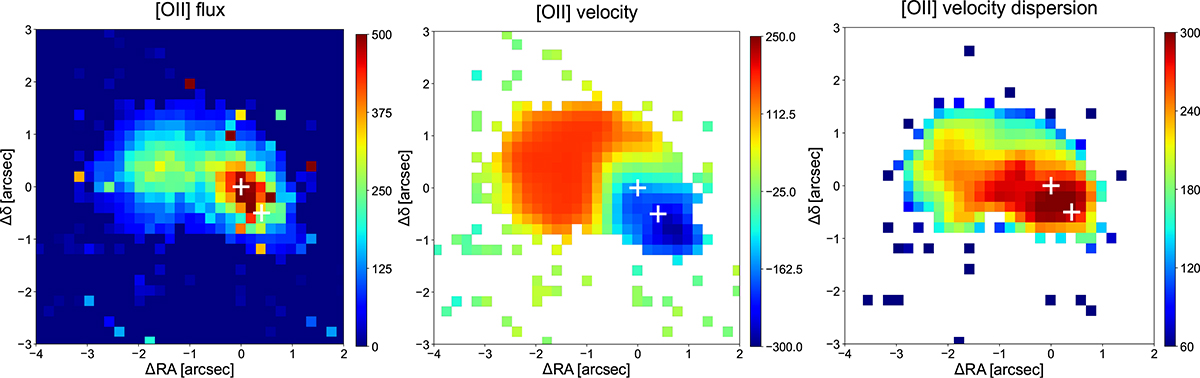
Results of pixel-by-pixel emission-line fitting. In the left panel we show the flux distribution of the [O II] doublet in units of 10−18 erg s−1 arcsec−2; the two crosses mark the location of the peak of emission in the red and blue components; i.e., of the two active nuclei. In the central panel we present the gas velocity, and in the right panel we show its velocity dispersion, both in km s−1 units.
Current usage metrics show cumulative count of Article Views (full-text article views including HTML views, PDF and ePub downloads, according to the available data) and Abstracts Views on Vision4Press platform.
Data correspond to usage on the plateform after 2015. The current usage metrics is available 48-96 hours after online publication and is updated daily on week days.
Initial download of the metrics may take a while.