Fig. 5.
Download original image
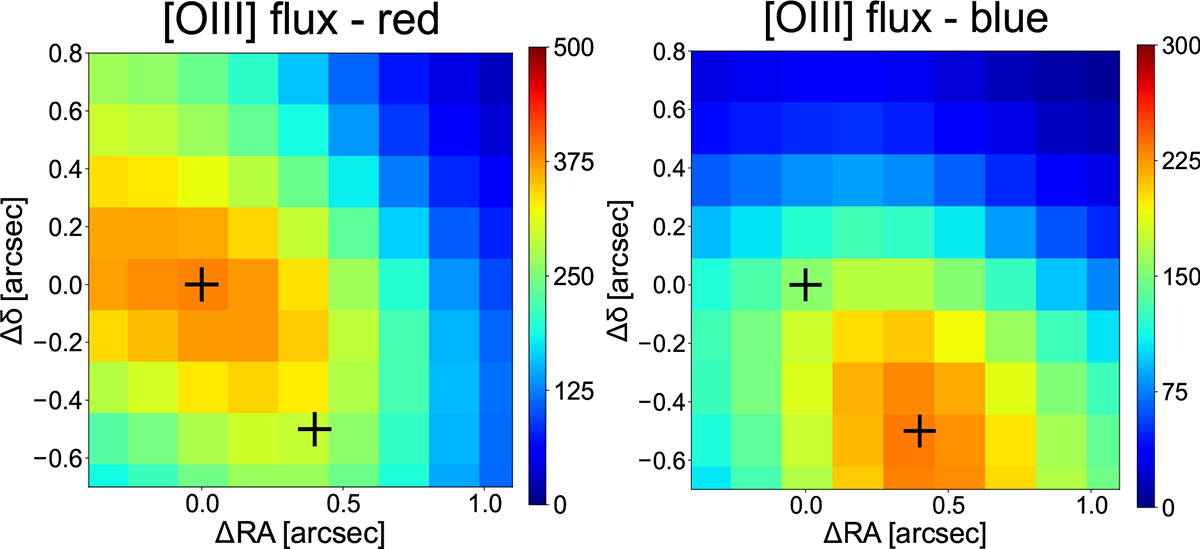
Results of pixel-by-pixel emission-line fitting for the nuclear region. In the left panel, we show the flux distribution of the red component of the [O III], while in the right panel we show the emission of the blue component. Both images have been smoothed with a Gaussian filter with a FWHM of one pixel. The two crosses mark the location of the peak of emission in the red and blue components.
Current usage metrics show cumulative count of Article Views (full-text article views including HTML views, PDF and ePub downloads, according to the available data) and Abstracts Views on Vision4Press platform.
Data correspond to usage on the plateform after 2015. The current usage metrics is available 48-96 hours after online publication and is updated daily on week days.
Initial download of the metrics may take a while.