Fig. 1
Download original image
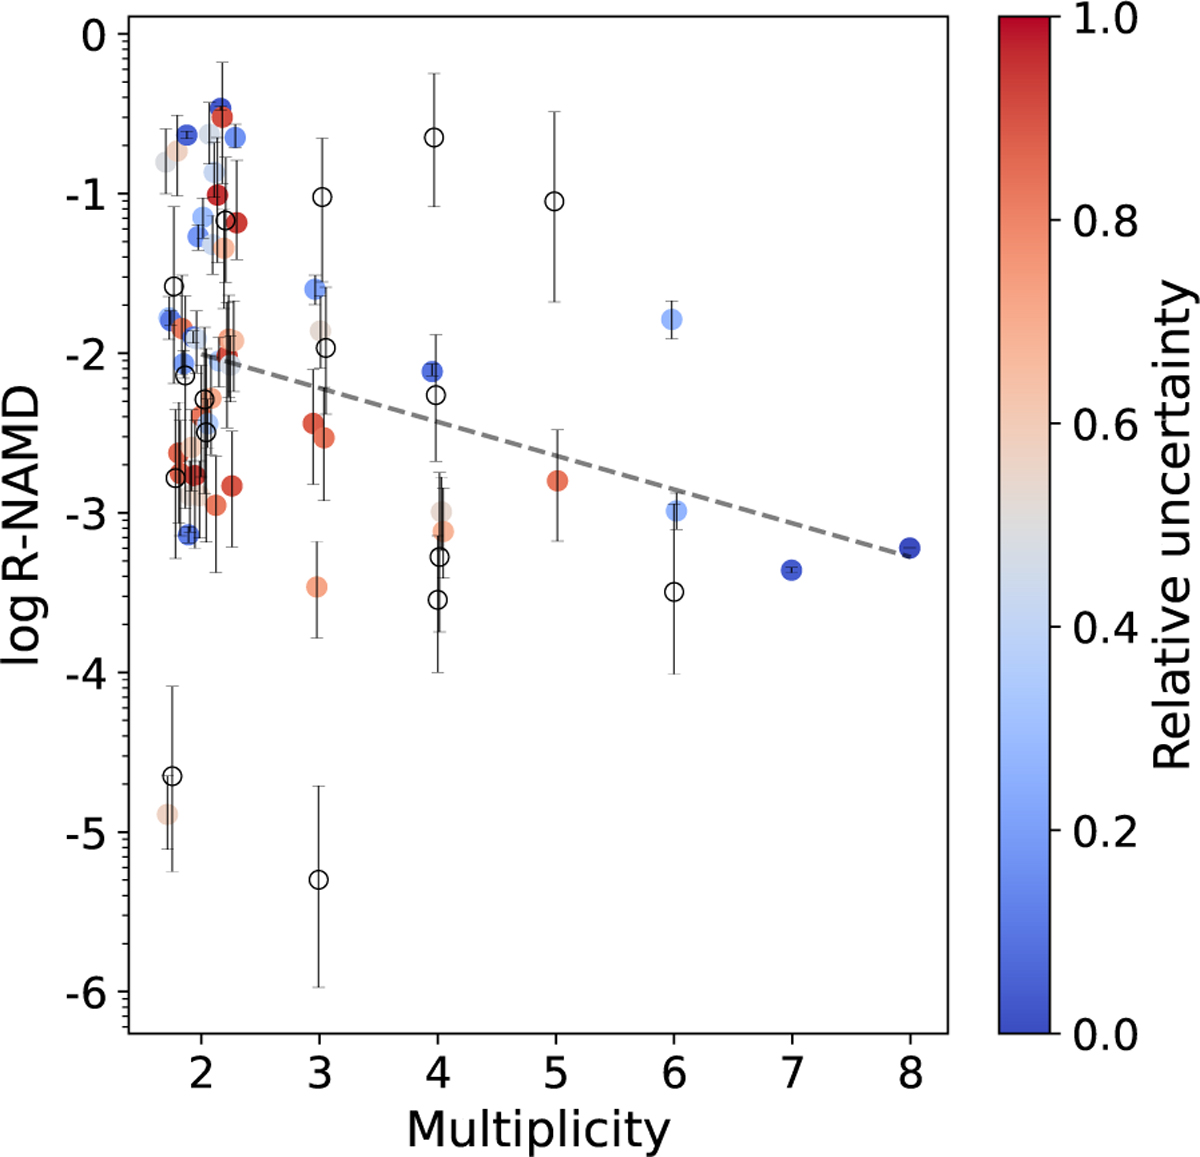
R-NAMD versus multiplicity plot for the core sample described in the text; same as Fig. 3 in T20, but with an expanded sample. The horizontal offsets around the multiplicity values are added arbitrarily for better visualization. The color-scale, capped at one, represents the relative uncertainty on the R-NAMD values, obtained from the arithmetic mean of the lower and upper errors from the Monte Carlo method. Systems with relative uncertainty above unity are plotted with a hollow white circle. The linear fit is shown only as a visual aid as the slope is highly dependent on the (few) high-multiplicity systems.
Current usage metrics show cumulative count of Article Views (full-text article views including HTML views, PDF and ePub downloads, according to the available data) and Abstracts Views on Vision4Press platform.
Data correspond to usage on the plateform after 2015. The current usage metrics is available 48-96 hours after online publication and is updated daily on week days.
Initial download of the metrics may take a while.