Fig. 4
Download original image
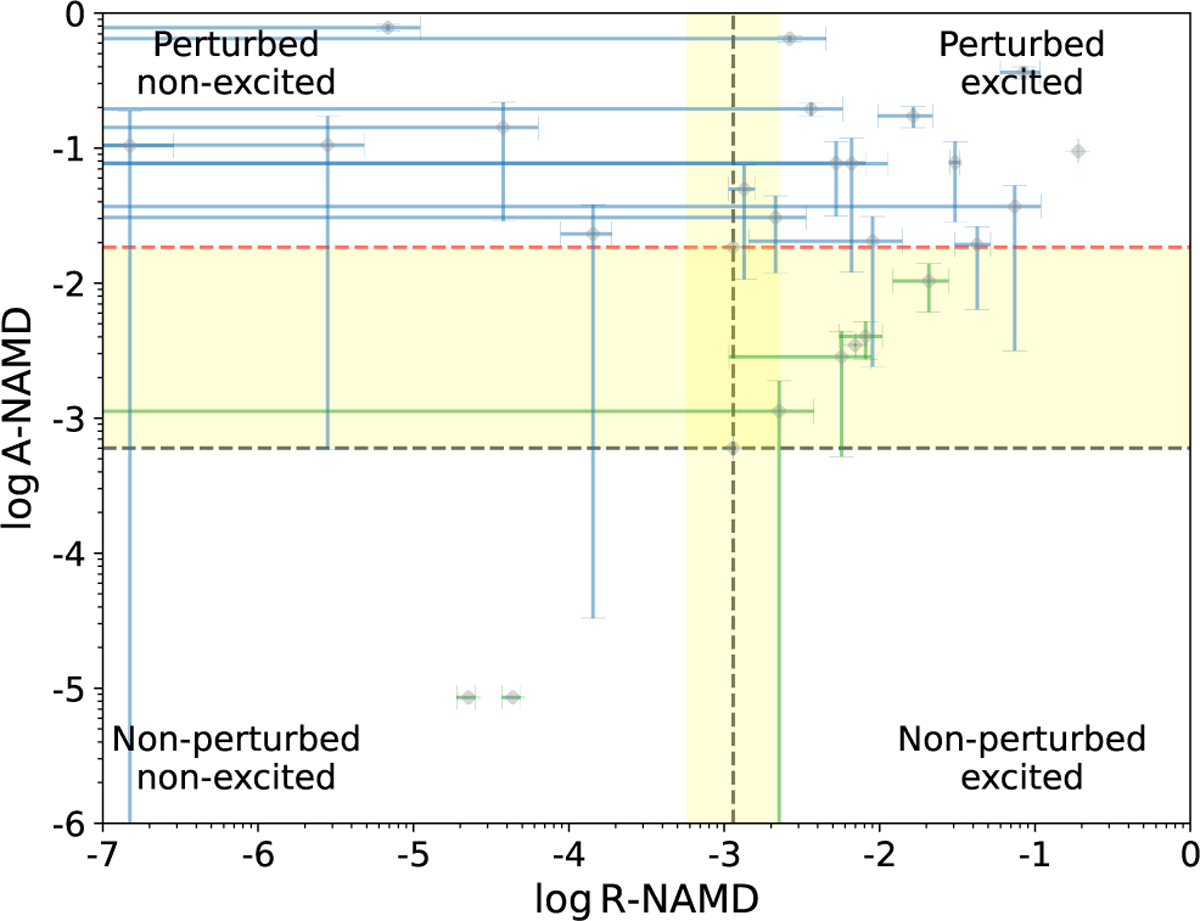
Four-quadrant diagram. This figure illustrates the possible states in which planetary systems can be found depending on their dynamical history, which is reflected in their eccentricities and spin–orbit angles. The Solar System is located at the intersection of the two gray dashed lines and separates the four quadrants, as discussed in the text. As an illustration, we include a value (red line) of a Solar System with planets misaligned by 15 degrees. The vertical highlighted area marks instead the R-NAMD values that can be associated with excited but stable systems that did not undergo large-scale instabilities in the simulations by Rickman et al. (2023). In addition, we included several synthetic systems based on real ones for which some parameters were missing (green points). These were inputted in order to better populate the quadrants.
Current usage metrics show cumulative count of Article Views (full-text article views including HTML views, PDF and ePub downloads, according to the available data) and Abstracts Views on Vision4Press platform.
Data correspond to usage on the plateform after 2015. The current usage metrics is available 48-96 hours after online publication and is updated daily on week days.
Initial download of the metrics may take a while.