Fig. 1.
Download original image
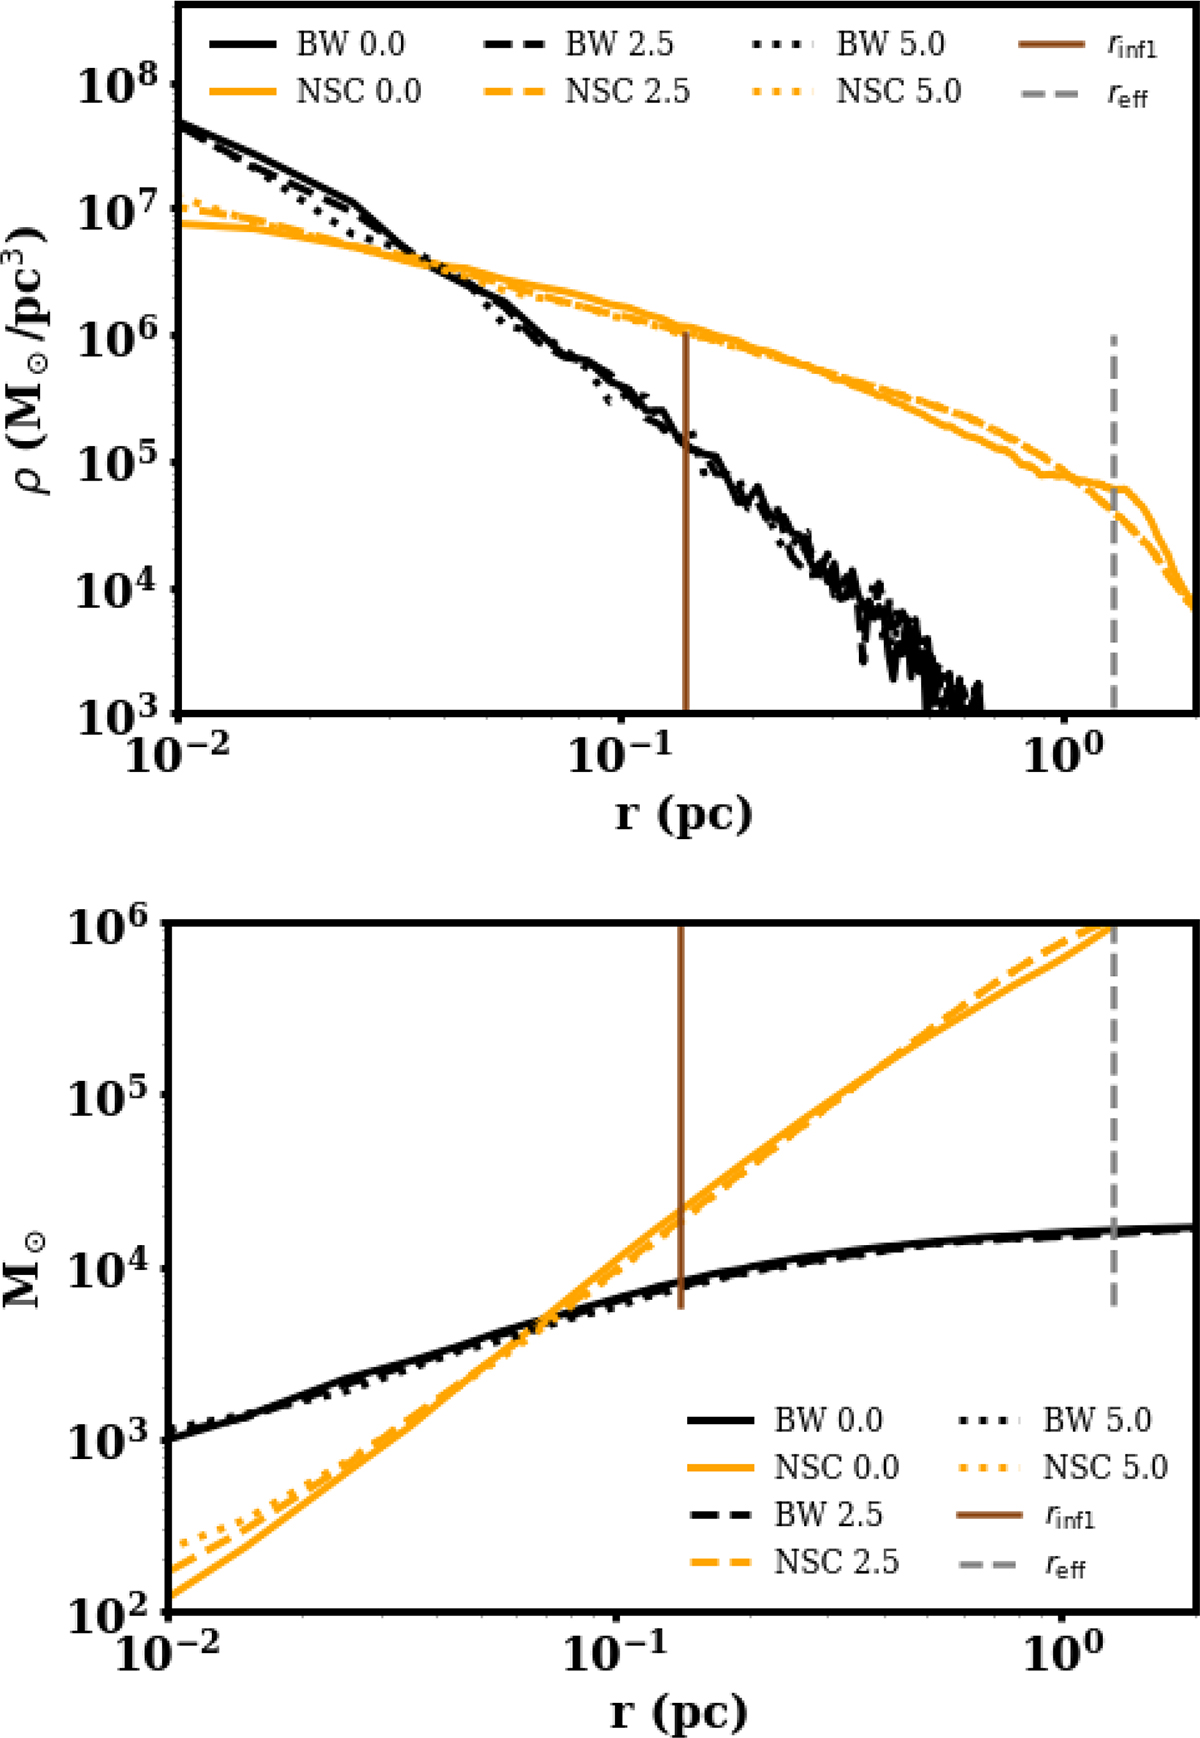
Volume density profiles of individual stellar (NSC) and BH (BW) components (top panel) and cumulative mass profiles of the same (bottom panel) for NGC205 NSC + BW model. The full lines represent initial profiles for the BH and stellar components, and dashed lines represent the same (in corresponding colors) at designated times in Myr. The vertical brown line represents the sphere of influence (rinfl1) of the IMBH for initial distribution, and the vertical gray line showcases the effective radius of the NSC.
Current usage metrics show cumulative count of Article Views (full-text article views including HTML views, PDF and ePub downloads, according to the available data) and Abstracts Views on Vision4Press platform.
Data correspond to usage on the plateform after 2015. The current usage metrics is available 48-96 hours after online publication and is updated daily on week days.
Initial download of the metrics may take a while.