| Issue |
A&A
Volume 706, February 2026
|
|
|---|---|---|
| Article Number | A354 | |
| Number of page(s) | 13 | |
| Section | Extragalactic astronomy | |
| DOI | https://doi.org/10.1051/0004-6361/202557283 | |
| Published online | 19 February 2026 | |
Intermediate-mass black hole binary evolution in nuclear star clusters: The effect of the stellar-mass black hole population
1
New York University Abu Dhabi PO Box 129188 Abu Dhabi, United Arab Emirates
2
Center for Astrophysics and Space Science (CASS), New York University Abu Dhabi Abu Dhabi, United Arab Emirates
3
Nicolaus Copernicus Astronomical Centre Polish Academy of Sciences ul. Bartycka 18 00-716 Warsaw, Poland
4
Szechenyi Istvan University, Space Technology and Space Law Research Center, H-9026 Gyor Egyetem ter 1., Hungary
5
Main Astronomical Observatory, National Academy of Sciences of Ukraine 27 Akademika Zabolotnoho St 03143 Kyiv, Ukraine
6
Astronomisches Rechen-Institut, Zentrum für Astronomie, University of Heidelberg Mönchhofstrasse 12-14 69120 Heidelberg, Germany
7
National Astronomical Observatories, Chinese Academy of Sciences, 20A Datun Rd. Chaoyang District 100101 Beijing, China
8
Kavli Institute for Astronomy and Astrophysics, Peking University, 5 Yi He Yuan Road Haidian District Beijing 100871, P.R. China
9
Department of Physics and Astronomy, Vanderbilt University Nashville TN 37240, USA
10
Department of Physics, Fisk University Nashville TN 37208, USA
★ Corresponding author: This email address is being protected from spambots. You need JavaScript enabled to view it.
Received:
17
September
2025
Accepted:
7
December
2025
Abstract
Aims. In this study, we investigate the dynamics of intermediate-mass black hole (IMBH) binaries within nuclear star clusters (NSCs) that contain a population of stellar-mass black holes (BHs). We examine how these stellar and BH populations influence the dynamics of the IMBH binary and, in turn, how the evolving IMBH binary affects the surrounding stellar and BH populations.
Methods. We conducted high-resolution N-body simulations of NSCs constructed based on observational parameters from two local dwarf galaxies: NGC205 and NGC404. For the first time, we achieved a star particle mass resolution of 1 M⊙ and a BH mass resolution of 10 M⊙. This level of resolution is crucial for accurately modeling the collisional dynamics of these dense systems.
Results. Including stellar-mass BHs within the stellar population significantly influences the IMBH binary dynamics, nearly doubling the sinking rate and halving the merger time. During the initial phase of the inspiral, the IMBH binary disrupts both the stellar and BH cusps. However, the BH cusp quickly regains its steep slope due to its shorter relaxation time and continues to dominate the evolution of the IMBH binary, despite being much less massive than the stellar component. We uncover an interesting mechanism in which BHs first efficiently extract energy from the IMBH binary and then transfer this energy to the surrounding stars, allowing the BHs to spiral back toward the center of the system and restart the process. Our results imply that although stellar-mass BHs are a minor component of a stellar population they can significantly facilitate IMBH growth within NSCs via mergers. We also notice that these dense systems can potentially boost intermediate-mass ratio inspirals (IMRIs) predominantly on radial orbits.
Key words: black hole physics / galaxies: dwarf / galaxies: kinematics and dynamics / galaxies: nuclei
© The Authors 2026
 Open Access article, published by EDP Sciences, under the terms of the Creative Commons Attribution License (https://creativecommons.org/licenses/by/4.0), which permits unrestricted use, distribution, and reproduction in any medium, provided the original work is properly cited.
This article is published in open access under the Subscribe to Open model. This email address is being protected from spambots. You need JavaScript enabled to view it. to support open access publication.
1. Introduction
Intermediate-mass black holes (IMBHs), with masses between 102 and 106 times that of the Sun, represent an elusive segment of the astrophysical black hole (BH) mass spectrum, which spans a vast range from approximately 10 solar masses to several billion solar masses (Kormendy & Ho 2013; Graham et al. 2015).
Local scaling relations between galaxies and their central BHs (Sturm & Reines 2024) suggest that IMBHs should exist at the centers of dwarf galaxies. These BHs can be identified either by the detection of gas accretion signatures or by dynamical studies that resolve the immediate vicinity of the BH, often referred to as its sphere of influence (Reines 2022; Askar et al. 2023). Over the past decade, several IMBH candidates have been identified in dwarf galaxies through spectroscopic evidence of active galactic nuclei (AGNs; Molina et al. 2021). Additionally, X-ray emission observed with the Chandra X-ray Observatory have provided further support for the presence of active BHs in these small galaxies (Baldassare et al. 2017). Other indirect evidence includes optical variability in AGNs (Baldassare et al. 2020) and tidal disruption events (French et al. 2020; Yao et al. 2025), both of which have been linked to the existence of IMBHs in dwarf galaxies. Intermediate-mass black holes with low accretion rates or those that are inactive, along with BHs in dwarf galaxies that are experiencing significant star formation, are challenging to detect, leaving the true occupation fraction of IMBHs in dwarf galaxies uncertain.
Many IMBH hosts also contain a dense central concentration of stars known as nuclear star clusters (NSCs), which are among the densest stellar environments in the universe (Neumayer et al. 2020). Nuclear star clusters typically have masses between 105 to 107 solar masses, with sizes ranging from a few to about 10 pc (Böker et al. 2004; den Brok et al. 2014; Georgiev & Böker 2014; Spengler et al. 2017). Nuclear star clusters with the highest occupation fractions (≲ 90%) are observed in galaxies with stellar masses of around 109 solar masses (Sánchez-Janssen et al. 2019). These NSCs are believed to be assembled through the infall of globular clusters (Tremaine et al. 1975; Capuzzo-Dolcetta 1993; Antonini & Merritt 2012) as is evidenced by their old stellar populations, although the existence of a young stellar population in some NSCs suggests that in situ star formation (Milosavljević 2004; Antonini et al. 2015) may also play a role. The efficiency of either assembly mechanism depends on the mass of the host galaxy. In more massive galaxies, in situ star formation is considered the dominant process, while in lower-mass galaxies, globular cluster inspiral appears to have a more critical role (Fahrion et al. 2022).
Due to their extremely high central densities, NSCs have relatively short relaxation times, on the order of a few billion years (Merritt 2009). Nuclear star clusters are also expected to harbor a population of compact objects, such as neutron stars (NSs) and BHs. Because these objects are more massive than the majority of the stellar population, they undergo mass segregation and sink toward the center of the cluster. Additionally, since the relaxation time is inversely proportional to the mass of the species, these compact objects are expected to relax much earlier than their stellar counterparts and form its own dynamical substructure. Within the influence radius of an IMBH, for example, the relaxed NS and BH population is likely to form a Bahcall & Wolf (1976, BW) cusp, with a characteristic r−7/4 density profile.
Multiple IMBHs can accumulate in a dwarf galaxy nucleus through the dynamical friction-driven inspiral of massive star clusters containing IMBHs, or through mergers of dwarf galaxies. Once in the galactic center, these IMBHs can form a bound binary system, which may further evolve through stellar dynamical processes (Begelman et al. 1980) and eventually coalesce via gravitational wave (GW) emission. The emission of GWs from IMBH binary sources will be detectable up to high redshift by Einstein Telescope (ET) and Cosmic Explorer (CE) (Di Giovanni 2025). Their access to low frequencies will make it possible to observe population of IMBHs up to about 104 M⊙ (Sathyaprakash et al. 2012; Abac et al. 2025)1. In the near future, the ESA/NASA space-borne GW observatory, the Laser Interferometer Space Antenna (LISA), and the Chinese projects TianQin and Taiji (Gong et al. 2021) will be able to detect IMBH mergers as well (Amaro-Seoane et al. 2023; Colpi et al. 2024; McCaffrey et al. 2025)2.
Recently, several studies have explored the binary IMBH evolution in merging NSCs (Ogiya et al. 2020; Mukherjee et al. 2023, 2025) or in an isolated galaxy environment (Khan & Holley-Bockelmann 2021). These studies conclude that IMBHs pair, form a binary system, and merge very efficiently in the dense NSC environment on a timescale ranging from about 100 Myr to approximately a gigayear. There can be a ten-fold difference in the merger timescales due to various structural and kinematic properties such as density and rotation of the host with respect to the initial orbit of inspiraling IMBH. In the absence of a NSC in dwarf galaxies, IMBH binaries have been shown to stall for longer than a Hubble time around a parsec separation (Biava et al. 2019; Khan et al. 2024; Partmann et al. 2024; Zhou et al. 2025).
Mukherjee et al. (2023) studied IMBH binary evolution in mergers of mass-segregated NSCs and found a strong dependence on the IMBH binary mass ratio; orbital evolution is accelerated for high-mass-ratio IMBH binaries, while it is prolonged when the IMBHs have comparable masses. However, we note that with stellar particle masses of 14.5 M⊙ and BH particle masses of 145 M⊙, relaxation may be an issue. Another caveat for this study is that only the NSCs were modeled. Khan & Holley-Bockelmann (2021) have shown that then the NSC-to-IMBH mass ratio ≤10, stellar encounters originating from the bulge significantly contribute to shrinking the binary orbit. For mass ratios greater than 10, IMBH binary evolution is governed predominantly by the stellar encounters originating from the NSC, and contributions from the surrounding bulge can be ignored.
We study IMBH binary evolution in observationally-motivated models of nearby NSC-embedded dwarf galaxies in which the NSC-to-IMBH mass ratio is greater than 10. For the first time in such studies, we achieve 1 M⊙ resolution for the stellar component, which is crucial to capture the accurate dynamics of collisional systems such as an NSC. We also include a stellar-mass BHs population (10 M⊙ each) within the influence radius of the IMBH that constitutes 1% of the total NSC mass (Panamarev et al. 2019). Our models are based on NGC205 and NGC404, because their structural, kinematic, and dynamical mass measurements are well resolved within the radius of influence of the IMBH (Nguyen et al. 2017, 2018). NGC205 and NGC404 are also ideal because the NSC-to-IMBH mass ratio is greater than 10, which allows us to focus only on the central NSC in unprecedented mass resolution.
The manuscript is organized as follows. Section 2 contains a description of our models and numerical techniques, Section 3 shows the results of IMBH binary evolution in NGC205 and NGC404 NSC models, and finally Section 4 presents a summary and concludes the findings of our study.
2. NSCs models and their stability
We built NSC models with parameters chosen for those observed in NGC205 (Nguyen et al. 2018) and NGC404 (Seth et al. 2010; Nguyen et al. 2017). NGC404 has two NSCs in addition to a surrounding bulge. However, here we build a composite model of the two NSCs such that its profile matches that of the combined profile of the two NSCs up to 5 pc. Our models also include a dark component in the form of stellar-mass BHs distributed in a BW cusp (Bahcall & Wolf 1976) within the sphere of influence of the central IMBH; the BH are initialized in a Dehnen profile (Dehnen 1993) with γ = 1.75. Table 1 shows the parameters of our initial NSC models. For the NGC205 NSC, the stellar component is constructed with 1.84 million particles, giving us a mass resolution of 1 M⊙, whereas the stellar-mass BH component has 1800 particles, achieving the desired mass resolution of 10 M⊙. The NSC in NGC404 is more than twice as massive as that of NGC205, requiring 4.25 million particles for the stellar component and 4250 particles for the BH component to achieve the same mass resolution. Our models are mildly triaxial, which is a key to ensuring a sustained supply of stars on centrophilic orbits in a hard IMBH binary regime (Li et al. 2015).
Initial NSCs parameters.
To distinguish between the impact caused by the presence of the stellar-mass BH component and the stellar distribution, we made comparisons to models with the exact same initial stellar profile, but no stellar-mass BHs. In the stellar-only models, we added the mass of the BH component to that of the stellar mass.
We utilized publicly accessible AGAMA software (Vasiliev 2019) to create our NSC components, adopting the Schwarzschild method to generate triaxial models. Our initial models are in dynamical equilibrium with the central IMBH. Figures 1 and 2 show density (top panel) and mass profiles (bottom panel) of stellar and BH components for NGC205 and NGC404 NSC models, respectively, at the initial time. For the NGC205 model, the BH component in the form of a BW cusp dominates both the density and cumulative mass in central region but as we approach the influence radius of the IMBH (marked by the vertical brown line), the stellar component clearly starts to take over and as we approach the effective radius of the NSC (marked by the vertical gray line), the stellar component dominates in mass by two orders of magnitude. The mass enclosed inside the sphere of influence of the IMBH for the NGC404 model is similar for both the stellar and BH components. Again, as r approaches the effective radius of the NSC, the stellar mass dominates by almost two orders of magnitude.
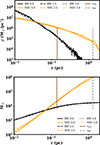 |
Fig. 1. Volume density profiles of individual stellar (NSC) and BH (BW) components (top panel) and cumulative mass profiles of the same (bottom panel) for NGC205 NSC + BW model. The full lines represent initial profiles for the BH and stellar components, and dashed lines represent the same (in corresponding colors) at designated times in Myr. The vertical brown line represents the sphere of influence (rinfl1) of the IMBH for initial distribution, and the vertical gray line showcases the effective radius of the NSC. |
2.1. Simulation codes
We used two versions of our N-body code; ϕ−GPU (Berczik et al. 2011, 2013) and ϕ−GPU hybrid, both employ a 4th order Hermite integration scheme to advance particles forward in time. Both codes also utilize individual block time-steps. ϕ−GPU is a pure N-body code, calculating pairwise forces between particles resulting in O(N2) scaling with particle number. It also employs individual softening for each particle. We have used ϕ−GPU extensively for large-scale N-body simulations of supermassive BHs in galaxy mergers (Khan et al. 2015, 2016; Sobolenko et al. 2022; Khan et al. 2025) as well as for IMBH binary evolution in nucleated dwarf galaxies (Khan & Holley-Bockelmann 2021).
The ϕ−GPU-hybrid, as the name suggests, employs a hybrid scheme to calculate the forces of each particle. It divides the particles into three categories: BHs, core, and halo particles. For both BH and core particles, forces are calculated in a pairwise scheme as in the case of ϕ−GPU; however, for halo particles, it employs the self-consistent field (SCF) method for force calculations (Hernquist & Ostriker 1992). We put the inner 10% of particles as the core particles. This covers roughly all BH particles and stellar particles upto three influence radii of the IMBH. This is the region with the highest density, where the relaxation time is the shortest, which means that the two-body interactions should be resolved effectively. Well beyond the influence radius, the stellar and BH densities fall considerably, causing the relaxation time to become larger, and the particles are expected to effectively follow the global potential created by the mass distribution. We employ the ϕ-GPU-hybrid code to evolve the IMBH binaries in the later phase of simulations that include both stellar and stellar-mass BH components, once the binary reaches a “hard binary” separation, commonly defined as (Merritt 2013)
 (1)
(1)
where μ is the reduced mass of the binary and σ is the velocity dispersion of the background distribution.
For the pairwise force calculation, we adopted an individual softening length of 10−4 pc for the stellar and stellar-mass BH particles. The forces between the IMBH pair are always computed with zero softening. Although we employed particle-specific softening to suppress numerical divergences, its value is very small (∼10−4 pc), retaining accurate close-encounter dynamics.
2.2. Model stability
Before invoking a secondary IMBH in our NSC models, we ran them for stability. We used ϕ−GPU to test the stability of our models. We evolved our models for upto 5 Myr. In our runs, an IMBH binary forms before 5 Myr, and the subsequent evolution of the system is greatly impacted by the IMBH binary presence.
Figures 1 and 2 show the initial and time-evolved density and cumulative mass profiles of the individual components of the NSCs for NGC205 and NGC404, respectively. Both density and cumulative mass profiles of individual components (stellar and BHs) appear to be reasonably stable throughout our stability analysis run for the two NSCs.
2.3. Secondary IMBH
We introduced secondary IMBHs with masses that are four times smaller than the primary IMBH in both models, this is 5.5 × 10³ M⊙ for NGC205 and 6.75 × 10³ M⊙ for NGC404. Only in the case of NGC205, we also introduce a BH in 40 times smaller with mass 5.5 × 10² M⊙. NGC404 NSC has a high number of particles (N = 4.25 × 10⁶), and it becomes computationally very expensive to model the 1:40 mass ratio IMBH binary case due to longer dynamical friction times. These secondary IMBHs are initially placed at a separation of 1 pc from the primary IMBH, with velocities equal to half the local circular velocity. The initial separations are well outside the influence radii of the IMBHs and are close to the effective radius of NSCs. We assume that secondary IMBHs to such a separation can be delivered by either a merger with a smaller dwarf galaxy or by an inspiralling star cluster having a central IMBH.
Direct N-body simulations have demonstrated the formation of IMBHs in dense star clusters by the following mechanisms: several generations of mergers of stellar-mass BH binaries through GW emission (Rizzuto et al. 2022, 2023; Arca Sedda et al. 2024), or by stellar collisions building a growing very massive stars, which then collapses to an IMBH (Vergara et al. 2024, 2025). In Rantala & Naab (2025) a combination of both processes leads even to the formation and merger of binaries of IMBH. All processes in the cited papers happen in a timescale of the order of 5 Myr.
3. Results
Here, we discuss the results of our N-body simulation suite for both NGC205 and NGC404 NSC models.
3.1. NGC205: IMBH binary evolution
We studied IMBH binary dynamics in NGC205 NSCs (with and without the BH component) with secondary IMBH having masses that are four and 40 times smaller than that of the primary IMBH.
3.1.1. NGC205: IMBH binary (1:4) evolution
We start with the results of IMBH pair evolution in NGC205 with a 1:4 mass ratio run – where the secondary is four times less massive than the primary. The evolution of the IMBH pair for this model, both with and without a BH component, is shown in Fig. 3. IMBHs’ separation (top panel) initially shrinks rapidly due to dynamical friction as the IMBHs become bound (Tb ≈ 0.4 Myr) and subsequently lose orbital energy via gravitational slingshots, shrinking their separation well below 0.01 pc in the first Myr of our simulation for both cases. Understandably, the separation shrinks quickly for a model with a BH component, as it provides additional background density for the dynamical friction phase and also for the three-body scattering phase when the IMBH binary separation shrinks below 0.1 pc. The shrinking of the binary, from its initial formation to the stage of hard binary formation, occurs over roughly a dynamical timescale – the timescale during which particles interact with the binary. For the NGC205 models, this timescale is approximately 1 Myr at a radius of 0.1 pc, both for models with and without BHs, since around r = 0.1 pc, the stellar and BH densities happen to become comparable.
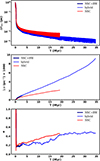 |
Fig. 3. IMBH pair and binary evolution in NGC205 models with (blue colors) and without (red color) a central BH cusp for a 1:4 IMBH mass ratio. The IMBH binary evolution in simulation performed with ϕ−GPU hybrid code is labeled as “hybrid”. Top panel: IMBHs orbit relative separation (ΔRbh). Middle panel: IMBHs orbit inverse semimajor axis (1/a). Bottom panel: IMBH binaries eccentricity (e). |
Later, a steadier phase of evolution governed by three-body scattering of stellar and BH particles is witnessed after a hard binary (Merritt 2013) forms around an inverse semimajor axis 1/a value of 500 pc−1 (middle panel). IMBH binaries form with a smaller value of eccentricity e ≈ 0.2 for both cases, which is growing to a value of e ≈ 0.4 during our run (bottom panel of Fig. 3). We estimate the IMBH binary hardening rate s = d/dt(1/a) at various times by fitting a straight line to the evolution of the inverse semimajor axis in the hard binary regime with a 5 Myr interval. Figure 4 shows the time evolution of the hardening rate for both cases: red filled circles with the solid line for the NSC + BW model and dashed line for the NSC model alone. The IMBH binary hardening rate is considerably higher (approximately 2–3 times) in the model with the BW cusp of stellar BHs when compared to the NSC model without a BH component. Also, both hardening rates show different trends. The s increases with time in the model with the BH component, whereas for the stellar component only model, it remains more or less constant with a slight decrease during the last interval witnessed in our simulation.
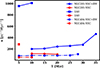 |
Fig. 4. IMBH binary hardening rates, s, at various times for all of our runs. |
In order to understand the reason behind the increased hardening rate for the BH component model, we analyze various properties of our models during the late stages of IMBH binary evolution. We first look up at the mass volume density profiles of the stellar component (only) in both models, with and without the BH population (see top panel of Fig. 5) at various values (labeled in figure) of 1/a. The density profiles for a particular 1/a value are very similar for the cases at influence radii (initial and final values). We notice a slightly higher density value for the NSC + BW model as we move closer to the center (r ≈ 0.01 pc). This slight increase is not sufficient to explain a factor 2 − 3 of the hardening rate difference in the two models. Next, we plot the mass volume density of both the stellar and the BH components for the NSC + BW model (see bottom panel of Fig. 5). Here, we notice that the density of the stellar component keeps on decreasing in the central part, as is expected from the core scouring by IMBH binary via three-body scattering (Merritt 2006; Berczik et al. 2006; Khan et al. 2011, 2012; Gualandris & Merritt 2012; Khan et al. 2016; Rantala et al. 2018) resulting in partial disruption of NSC as is witnessed in Khan & Holley-Bockelmann (2021). In contrast, the density profile of the BH component tends to become steeper after initial core scouring. The same trend is translated to cumulative mass profiles evolution (Fig. 6) for BH and stellar components, where we see that the BH component steepens after initial core scouring by the IMBH binary, and stellar mass continues to decline inside the influence radius.
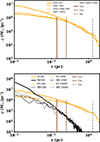 |
Fig. 5. Density profiles for NGC205 models with 1:4 mass ratio. Top panel: Density profile of stellar components in NSC + BW and NSC models. The 00 line is the initial stellar profile, which is the same for both models. Thick and thin vertical brown lines are influence radii at the start and end of our NSC + BW model run, respectively. The different lines are density profiles of the designated models at the labeled 1/a value of the IMBH binary. Bottom panel: Density profile of stellar (ST) and black hole (BH) components in the NSC + BW model. The full lines are initial profiles and dashed or dotted lines are profiles at designated values of 1/a for stellar (orange color) and BH component (black color). |
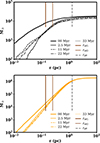 |
Fig. 6. Cumulative mass profiles (in solar masses) of the BHs (top panel) and stellar distribution (bottom panel) for the NGC205 model with BH component for 1:4 mass ratio at various times during IMBH binary evolution. Thick and thin vertical brown lines are the initial and final values of the influence radius, respectively, and the vertical gray line is the initial effective radius of NSC. |
We plot the slope of the inner cusp during IMBH binary evolution (see Fig. 7) for the density profile as a function of time for individual species and also for the combined mass of stars and BHs. We can see from the top panel of the figure how the power index (γ) drops as the binary transitions from its formation to a hard binary regime, indicating flattening of density slopes in the center for both the stellar and BH distributions (as is evident from Fig. 5). As the IMBH binary evolves further in time (bottom panel) in the hard binary regime, we notice that the profile of stellar component maintains roughly the same slope (shallow density profile), however, the density profile of the BH component evolves and approaches r−7/4 and remains close to this as it is a steady state solution for the dominant mass component around a massive BH.
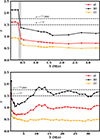 |
Fig. 7. Evolution of the logarithmic density slope parameter γ for NGC205 with 1:4 mass ratio. γ was calculated by fitting and averaging over the nine snapshots in a timespan of ≈0.1 Myr. The errors of the averaging are less than one percent. The color coding represents three different components: BHs (black), stars (orange), and all particles (red). The top panel shows the γ for the first 3.5 Myr of the evolution, whereas bottom panel shows the same for full-time evolution. The gray zone in the top panel indicates the IMBH binary formation to a hard binary transition time. Dashed horizontal lines show ρ(r) relations for various power indices, including the BW cusp. |
A BW cusp that reestablishes itself after initial erosion caused by an IMBH binary must happen at relaxation timescales. Figure 8 shows the relaxation time estimates for various components at T = 0 Myr (top panel) and T = 34 Myr (bottom panel) for the model with the BH component. We observe that as the radius approaches 0.01 pc, the relaxation time for the BH component is initially on the order of 1 Myr, increasing to around 10 Myr in the later stages of the IMBH binary’s evolution, after it has eroded the central cusp. These timescales are consistent with the formation of a BW cusp around 10 Myr, as is demonstrated in Fig. 7.
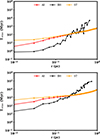 |
Fig. 8. Relaxation time as a function of distance from the center at initial time (top panel) and at final time T = 34.5 Myr (bottom panel) for NGC205 with 1:4 mass ratio IMBHs. The relaxation time was calculated using the relation from Binney & Tremaine (2008). The color coding is for the three different components: BHs (black), stars (orange), and all particles (red). |
Now we discuss how the presence of a BW cusp for the BH component impacts the IMBH binary evolution, specifically focusing on the hardening rates. The hardening rate of an IMBH binary is expected to be related to properties of galactic nuclei through
 (2)
(2)
where ρ and σ are density and velocity dispersion, respectively, and both these quantities are typically measured at the binary’s sphere of influence (Sesana & Khan 2015). H is a dimensionless hardening parameter, and its value for the full loss cone regime is ≈14 as was suggested by the scattering experiments (Quinlan 1996; Sesana 2010).
From Fig. 5, we see that BHs maintain a density comparable to that of the stellar population close to the center, which can lead to a similar hardening as provided by the stellar component. We also plot the velocity dispersion profiles of stellar and BH components for both of the cases, as is shown in Fig. 9. Clearly, the BH component has lower velocity dispersion compared to the stellar component for the same values of 1/a. The lower value of the velocity dispersion boosts the hardening rate contribution by the BHs component (see Equation (2)). Thus, the higher hardening rate witnessed in the model with the BH component can be attributed to the sustained cuspy density profile of the BHs close to the center and their lower velocity dispersion relative to stars.
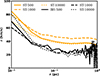 |
Fig. 9. Velocity dispersion profiles of BHs and stellar components for the NGC205 model with 1:4 mass ratio IMBHs at different times for labeled values of 1/a. |
We also plot the spatial distribution of the particles for a duration of 2–8 Myr of the run after they are scattered by the IMBH binary in a hard binary regime (see left panel of Fig. 10). Also, the right panel of the figure shows the number of particles scattered at different angles. We see that particles are preferentially ejected in the direction of the IMBH binary plane.
 |
Fig. 10. Distribution of particles final ejection direction by the IMBH binary on the timescale T = 2–8 Myr for NGC205 with 1:4 mass ratio. The color code is time in the left panel and the number of particles in each bin in the right panel. Black (left) and red (right) crosses on the plots’ top are the IMBH binary angular momentum direction. The asymmetry in positive and negative θ directions is at the level ≈40%. Particles generally are ejected in the direction of the IMBH binary orbital plane for a chosen time interval. |
3.1.2. NGC205: IMBH binary (1:4) merger timescales
We do not include relativistic effects such as GW emission on the fly in our simulations. Instead, from the time we stop our runs, the IMBH binary semimajor axis and eccentricity are evolved using the prescription developed in our earlier studies (Khan et al. 2012; Sesana & Khan 2015). We adopt a constant value for s and e at the end of each simulation, whereas energy loss caused by GW emission is taken into account using the analytical expression of Peters & Mathews (1963). The resulting evolution of 1/a and e is presented in the top and bottom panels of Fig. 11, respectively. For model NSC + BW, an e value of 0.46 measured at the end of our simulation, the IMBH binary achieves a merger around 115 Myr. However, if e continues to grow and reaches a moderate value of e ≈ 0.75, then a merger can be achieved around 80 Myr. We also use lower values of s = 3.0 and 2.5 to estimate the IMBH binary merger time, resulting in IMBH coalescence in roughly 150 Myr and 200 Myr, respectively. The merger of IMBHs in the model with a stellar-only component takes place at a much longer time T ≈ 320 Myr. This is understandable, as the higher hardening rates witnessed for the NSC + BW model translate into a shorter IMBH binary merger time, given that the eccentricity value is similar for both runs.
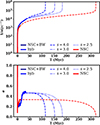 |
Fig. 11. IMBH binary parameter evolution for NGC205 model with 1:4 mass ratio IMBHs. Top panel: Inverse semimajor axis of IMBH binaries in our simulation (full lines) and its estimated evolution (dashed and dotted lines) taking into account energy loss through GW emission. The evolution is estimated using different values of s for the NSC + BW model. Bottom panel: Eccentricity of IMBH binaries in our simulation. The line and color scheme is the same as employed for 1/a plot in top panel. |
3.1.3. NGC205: IMBH binary (1:40) evolution
In order to investigate the effect of different mass ratios, we perform a run with a 1:40 mass ratio of IMBHs. We kept the primary IMBH mass fixed but introduced a secondary that is 40 times less massive than the primary. The hardening rates for IMBH binaries are shown as red rectangles in Fig. 4. We notice hardening rates roughly three times higher for the NSC model only and four times higher for NSC + BW model. This is within a factor of 2 of the change in reduced mass as we moved from 1:4 to the 1:40 mass ratio of the IMBH binary, and in line with (Berczik et al. 2022) who found that hardening rate scales inversely with the reduced mass for a fixed density distribution of the host.
3.1.4. NGC205: IMBH binary (1:40) merger timescales
Figure 12 shows the complete evolution of the IMBH binaries, including the estimated evolution taking into account the GW emission. For both cases, with and without BH components, we notice rapid eccentricity growth after binary formation in the three-body scattering phase. In both cases, the eccentricity e approaches unity, leading to a rapid decay of the IMBH binary orbits through enhanced GW emission. The eccentricity reaching a very high value close to unity for high mass ratios has previously been reported in N-body simulations of SMBH binaries both in isolated galaxy models (Iwasawa et al. 2011), and also in galaxy mergers (Khan et al. 2015). The coalescence times of IMBHs are 7 and 23 Myr for models with and without the BH component, respectively, significantly shortened by a very high value of e.
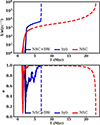 |
Fig. 12. Top panel: IMBH binary inverse semimajor axis in our simulation (full lines), and its estimated evolution (dashed lines) for NGC205 models with 1:40 mass ratio IMBHs. Bottom panel: Eccentricity evolution of IMBH binaries. |
3.2. NGC404: IMBH binary evolution
We investigated the dynamics of IMBH binaries in NGC404 NSCs, both with and without a central BH component, considering secondary IMBHs with masses 4 times smaller than that of the primary.
3.2.1. NGC404: IMBH binary (1:4) evolution
The evolution of the IMBH binary for NGC404 NSC models is presented in Fig. 13. We observe a slower shrinking of the IMBH binary separation (top panel) in the absence of a BH component, compared to that where a BH component is present. A similar trend is also observed in the evolution of 1/a (middle panel), where the IMBH binary with BH component evolves more rapidly. This behavior can be explained by examining the density profiles of the stellar and BH populations in the top panel of Fig. 2. The density is high and has a steeper slope in the case of the BH component, whereas it is lower with a much shallower slope in the stellar component. As was discussed earlier, the evolution of the IMBH binary strongly depends on the density profile of the background mass distribution in both the dynamical friction (Just et al. 2011) and the three-body hardening phase. The IMBH binary eccentricity remains low for the duration of our runs.
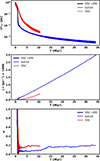 |
Fig. 13. IMBH pair and binary evolution in NGC404 models (with and without a central BH cusp). Top panel: IMBH orbit relative separation (ΔRBH). Middle panel: IMBH binaries orbit inverse semimajor axis (1/a). Bottom panel: IMBH binaries eccentricity (e). |
Again, as in earlier cases, we estimated IMBH binary hardening rates s for both runs by fitting a straight line at various times (Fig. 4). Again, we witness a higher value of s for IMBH binary evolving in NSC + BW model (filled blue circles with full line). The hardening rates remain steady and start to increase toward the end of our run. This trend is consistent with what we witnessed for the NGC205 model with a BH component. The value of s remains almost constant for the NSC model without the BH component.
We analyzed the evolution of the density profile for the NSC + BW model, as is shown in Fig. 14. The top panel of the figure showcases the density evolution of both stellar and BH components as the binary forms and transitions to a hard binary phase (T ≈ 2 Myr). We notice that the BH component got significantly eroded while the stellar profile changes less strongly. In the bottom panel of the figure, which presents the evolution in a hard binary regime, we only see a very slight decrease in BH stellar density profiles, whereas again the stellar component retains its profile. In the hard binary regime, IMBH binary’s semimajor axis shrank by an order of magnitude. However, we do not witness a noticeable change in both the stellar and BH profiles close to the center. This suggests that energy deposited by the IMBH binary is distributed at much larger spatial scales.
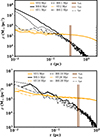 |
Fig. 14. Density profile for NGC404 model. Top panel: Density profile of stellar and BH components in NSC + BW before and after a hard binary forms. Bottom panel: Time evolution of stellar and BH component density profile in the late phase of IMBH binary evolution. |
Again, for NGC404, we calculate relaxation times (see Fig. 15) for both the stellar and BH components at the start of the simulation (top panel) and later in the hard binary regime (bottom panel). Initially, within the inner 0.1 pc (approximately the influence radius of the IMBH), the relaxation time is around 10 Myr for the BH component and a few hundred Myr for the stellar component. As the IMBH binary erodes the central cusp, these relaxation times increase by an order of magnitude.
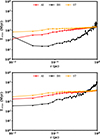 |
Fig. 15. Relaxation time at various distances from the center at initial time (top panel) and at final time T = 27.5 Myr (bottom panel) for NGC404. Relaxation time was calculated using Binney & Tremaine (2008). The color coding is the three different components: BHs (black), stars (orange), and all particles (red). |
Because the relaxation time is longer than the duration of our run, the BH component does not achieve the BW cusp level, as seen from Fig. 16. The BH component has the steepest slope in density between −1 and −1.5, whereas the stellar component has a much shallower slope of −0.25.
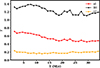 |
Fig. 16. Evolution of the inner logarithmic density slope parameter γ for NGC404 NSC + BW run. The parameter γ was calculated by fitting and averaging over the nine snapshots in a time span of ≈0.1 Myr. The errors of the averaging are less than one percent. The color coding represents three different components: BHs (black), stars (orange), and all particles (red). |
We investigate the energy changes of individual species and those of the entire system and present them in Fig. 17. We start our discussion with the energy change of the IMBH binary (olive line). We notice that the total energy change of the IMBH binary from a hard binary until we stop our run is roughly 0.02 in our model units. This energy must be deposited into the stellar and BH components to maintain energy conservation. If we look at how the energy of the BH component evolves (black line), we notice that the gain is only a fraction of the total change experienced by the IMBH binary. Even if the BH component deposits all its binding energy in the IMBH binary, it would not significantly change the IMBH binary energy because one can witness from Fig. 17 that the BH component only carries a tiny fraction of the total energy of the system. We notice that the total energy of the BH component becomes positive, but it does not mean that the BH component has become unbound from the system, as we can still see a strong cusp of BHs around the IMBH binary in Figs. 14 and 16. This net total positive energy of the BH component should be caused by some strong encounters with the IMBH, resulting in a large gain in kinetic energy. However, the total energy gained by the stellar component (brown line) is similar to that of energy loss by the IMBH binary. This suggests that most of the energy lost by the IMBH binary is deposited into the stellar component. This raises the question of why we do not see a significant impact on stellar density profiles in the vicinity of the IMBH binary. Also, for the case where no BH component is present, we notice significantly smaller hardening rates. So the BH component indeed contributes to the hardening of the IMBH binary as much as the stellar component, if not more, but a question that arises is why the energy budget of the individual components does not reflect the same picture.
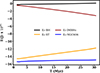 |
Fig. 17. Total energy of the whole system (blue), stellar component (orange), BH component (black), and IMBH binary (brown) for the whole duration of our simulation for the NGC404 NSC + BW run. |
Our explanation for this discrepancy is that although BHs suck most of the IMBH binary energy through three-body encounters, they sink back toward the center through collisional mass segregation with the stellar component on relatively short timescales, as they are ten times more massive than the stellar particles. In the process, they deposit the energy in the stellar component. The profiles for both the stellar and BH components remain more or less the same; for BHs, because they constantly move in and due to mass segregation and three-body scattering with the IMBH binary, and for stars, because they can exchange energy from the BH component at larger distances. Additionally, it is reassuring to witness that the total energy of the whole system remains constant during the whole run. A related mechanism, operating on a different scale during star-cluster assembly, involves low-mass IMBH (∼100–1000 M⊙) triple system in which one member is ejected and later returns to the center after losing energy, a process highlighted as an important channel for IMBH growth through mergers in hierarchical triple BH systems (Rantala et al. 2024; Liu et al. 2024; Souvaitzis et al. 2025).
To test our hypothesis, we ran an additional run for the NGC404 model, this time with the BH component only. To make our model consistent with the previous model, we introduce a stellar component as an external potential so that its gravitational potential is there, but it will not undergo energy exchanges with the IMBH binary, as well as with the BH component. Figure 18 shows how the density of the BH component evolves in case there is no stellar component to exchange energy with. We see that over time, IMBH binary scours the core, and by the end of the simulation, at a time corresponding to 30 Myr, the cusp is totally erased inside the inner 1 pc. This strengthens our understanding that energy exchange between stellar and BH components, together with mass segregation, is key to maintaining the BH cusp around the IMBH binary, resulting in efficient hardening of the binary.
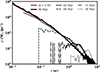 |
Fig. 18. Density changes as a function of time (in Myr) induced by IMBH binary in BH component in the absence of a stellar mass distribution (realized as an external potential) for the NGC404 NSC + BW run. |
3.2.2. NGC404: IMBH binary (1:4) merger timescales
The eccentricity of the binary remains very low in both cases, with and without a BW cusp. The hardening rates (in model units) for the binary are 0.76 with the BH component and 0.46 without the BH component. IMBH binary hardening rate in the model with BH component increases with time and reaches a value of 0.98 at the time we stop the run (Fig. 4).
We evolve the binary in both scenarios using these hardening rates and accounting for GW emission. The resulting evolution is depicted in Fig. 19. We observe that the merger time for IMBHs in the stellar component model is almost twice as long as the model that includes a BH component. Because the eccentricities are very similar, this difference is directly related to the variation in hardening rates.
 |
Fig. 19. Inverse semimajor axis of IMBH binaries in our simulation (full lines) and its estimated evolution (dashed lines) for the NGC404 NSC + BW model. |
4. Summary and conclusion
We perform high-resolution N-body simulations of IMBH pair in NSCs. The structural and kinematic parameters are motivated by the observations of NSCs in nearby dwarf galaxies, namely NGC205 and NGC404. For the first time in numerical simulations of IMBH dynamics in NSCs, we achieve a mass resolution of 1 M⊙ for the stellar component. We also include a dark stellar-mass BH component with a BW cusp inside the influence radius of the central IMBH. The BH component has a mass of one percent of that of the NSC. Well inside the influence radius, stellar BHs dominate in the mass density, and as we approach the influence radius, the stellar component takes over (see Figs. 1 and 2). The BH particles are realized with 10 M⊙ particles. To make a comparison and better understand the impact of the BH component, we also study the evolution of the IMBH pair for each model where the BH component is absent. We introduce the secondary IMBH with varying masses on moderately elliptical orbits (e ≈ 0.6) at an initial separation of 1 pc. We assume that IMBHs can be delivered to the center of dwarf galaxies either by inspiralling star clusters and/or mergers between dwarf galaxies. Dense star clusters are known to form an IMBH quite quickly (see the paragraph and citations at the end of Sect. 2.3). In the following, we summarize key findings of the study:
-
IMBHs form a bound system in a few million years mainly because the secondary IMBH is already inside the effective radius of the NSC, where high stellar and BH densities result in shorter dynamical friction time.
-
An IMBH binary quickly disrupts the stellar and BH cusps as it enters a hard binary phase, resulting in a density drop of both the stellar and BH components by an order of magnitude in the center. The BH densities dominate very close to the IMBH binary (r ≈ 0.01 pc), but as we move out to the influence radius, stellar densities start to take over (see Figs. 5 and 14). This is true for both the NGC205 and NGC404 cases.
-
IMBH binaries form and maintain low to moderate eccentricities for comparable masses of IMBHs for both cases. However, for the more extreme mass ratio (1:40) in NGC205, the IMBH binaries achieve a very high eccentricity that approaches unity in the hard binary phase.
-
The presence of a BH component significantly enhances hardening rates compared to the case where a BH component is absent. Also, the trend of the hardening rate as a function of time in the hard binary regime is different. For models with a BH component, hardening rate increases with time, and for models without a BH component, it decreases more in line with earlier studies of SMBH binaries in galactic nuclei.
-
Due to a very short relaxation time, especially in NGC205, the BH component reestablishes a BW cusp, which is initially eroded by the IMBH binary. The cusp stays there for the whole duration of our run, resulting in an efficient energy extraction from the IMBH binary’s orbit.
-
Although BHs are only one percent of the stellar component, and even if they lose all of their binding energy, it would account for a tiny fraction of IMBH binary’s orbital energy. However, we discover an interesting mechanism in which they carry away energy from the binary, exchange it with the stellar component, and segregate back toward the center, thus generating an efficient cycle of energy loss for the IMBH binary.
-
Due to higher hardening rates, IMBH binaries evolving in models with a BH component attain mergers in timescales that are roughly twice as short as their counterparts that do not include a BH component.
-
For high mass ratios, IMBH binaries achieve merger in very short timescales close to 10 Myr, aided by very high eccentricity that approaches unity. The timescales are short for both cases, with and without a BH component, caused by a very high value of eccentricity. This may have important consequences for the growth of IMBHs in NSCs, as very short merger timescales provide a very viable channel for the growth mechanism through mergers with compact objects.
-
The shorter merger time (by a factor of 15–20) in cases where the secondary IMBH is much lighter than the primary (1:40) can potentially boost intermediate-mass ratio inspirals (IMRIs). Here, again presence of a BH component significantly shortens the binary merger time.
-
The IMBH binary mergers found in our simulations should be observable at the upper frequency end of future space based instruments (LISA, Tianqin and Taiji) as well as future ground based Einstein Telescope (ET) and Cosmic Explorer (CE), see citations in Sect. 1. In the best case the combination of all these instruments will deliver a census of IMBH across a large redshift range, which makes it important to start early enough with detailed numerical modeling and accurate estimates of merger timescales (Holley-Bockelmann et al. 2025).
Our models adopt single-mass stellar particles and a single-mass BH component. This allows us to study the dynamical interaction between the IMBH binary and the surrounding subsystems, but does not capture the full complexity of a realistic stellar initial mass function. A high-mass tail of stellar-mass BHs could lead to the formation of triple systems and potentially affect the orbital decay. Additionally, mass segregation of BHs scattered by an IMBH binary is sensitive to the individual BH masses: more massive BHs reach the center faster and can accelerate energy transfer from the IMBH binary, whereas less massive BHs lead to longer decay times and less efficient energy extraction. Whether these effects offset each other or one dominates is an interesting question, and we will investigate the impact of a realistic BH mass function on IMBH binary evolution in a forthcoming study.
Although ϕ−GPU is capable of modeling IMBHs dynamics in the relativistic regime with PN terms up to 3.5, here we do not include this effect primarily because these terms become relevant only once the IMBH binary reaches semi-major axes of ∼10−5 pc, much smaller than a typical value of ∼10−4 pc achieved in our simulations. Our work focuses on the Newtonian hardening phase; and the subsequent evolution of IMBH binaries is treated semi-analytically.
NSCs in dwarf galaxies are expected to experience episodic gas inflows which boost star formation and IMBH growth through gas accretion (Partmann et al. 2025). Hydrodynamics would introduce additional drag and torques, accelerating the merger of IMBHs in the binary (Duffell et al. 2020; Bortolas et al. 2021; Franchini et al. 2022; Siwek et al. 2023). In both systems considered here, the NSCs are dynamically dominated by stars, with gas contributing only a minor fraction (a few percent) of the central mass (De Looze et al. 2012; Davis et al. 2020). In this regime, stellar dynamics is expected to be the primary driver of IMBH binary evolution.
We model IMBH binary dynamics in an isolated NSC environment. The outer dwarf-galaxy potential is ignored because our modeled NSCs are much denser and dynamically dominant in the central parsecs. In our previous study Khan & Holley-Bockelmann (2021), we demonstrated that for NSC/IMBH mass ratios greater than 10, which is the case for both NGC205 and NGC404, the contribution of encounters from the surrounding galaxy is not significant.
Overall, while these simplifications limit the completeness of the physical processes involved in IMBHs dynamics in NSCs, they do not affect the mechanism identified in this work–namely, the enhanced hardening and shortened merger times of the IMBH binary driven by the centrally concentrated cusp of stellar-mass BHs. Future simulations that incorporate a full mass spectrum and relativistic effects will enable a comprehensive examination of IMBH binary evolution in more realistic NSC environments.
Acknowledgments
The authors gratefully acknowledge the Gauss Centre for Supercomputing e.V. (www.gauss-centre.eu) for funding this project by providing computing time on the GCS Supercomputer JUWELS (Jülich Supercomputing Centre 2021) at Jülich Supercomputing Centre (JSC). We acknowledge support from High Performance Computing resources at New York University Abu Dhabi. This material is based upon work supported by Tamkeen under the NYU Abu Dhabi Research Institute grant CASS. Rainer Spurzem is grateful for support by the German Science Foundation (DFG), grant No. Sp 345/24-1, and acknowledges NAOC (National Astronomical Observatories of Chinese Academy of Sciences, Beijing) International Cooperation Office for its support in 2023, 2024, and 2025, and the support by the National Science Foundation of China (NSFC) under grant No. 12473017. RS is supported from the Chinese Academy of Sciences President’s International Fellowship Initiative for Visiting Scientists (PIFI, 2026PVA0089). Peter Berczik and Margarita Sobolenko thank the support from the special program of the Polish Academy of Sciences and the U.S. National Academy of Sciences under the Long-term program to support Ukrainian research teams, grant No. PAN.BFB.S.BWZ.329.022.2023.
References
- Abac, A., Abramo, R., Albanesi, S., et al. 2025, arXiv e-prints [arXiv:2503.12263] [Google Scholar]
- Amaro-Seoane, P., Andrews, J., Arca Sedda, M., et al. 2023, Liv. Rev. Relat., 26, 2 [NASA ADS] [CrossRef] [Google Scholar]
- Antonini, F., & Merritt, D. 2012, ApJ, 745, 83 [NASA ADS] [CrossRef] [Google Scholar]
- Antonini, F., Barausse, E., & Silk, J. 2015, ApJ, 812, 72 [Google Scholar]
- Arca Sedda, M., Kamlah, A. W. H., Spurzem, R., et al. 2024, MNRAS, 528, 5140 [CrossRef] [Google Scholar]
- Askar, A., Baldassare, V. F., & Mezcua, M. 2023, arXiv e-prints [arXiv:2311.12118] [Google Scholar]
- Bahcall, J. N., & Wolf, R. A. 1976, ApJ, 209, 214 [NASA ADS] [CrossRef] [Google Scholar]
- Baldassare, V. F., Reines, A. E., Gallo, E., & Greene, J. E. 2017, ApJ, 836, 20 [NASA ADS] [CrossRef] [Google Scholar]
- Baldassare, V. F., Geha, M., & Greene, J. 2020, ApJ, 896, 10 [NASA ADS] [CrossRef] [Google Scholar]
- Begelman, M. C., Blandford, R. D., & Rees, M. J. 1980, Nature, 287, 307 [Google Scholar]
- Berczik, P., Merritt, D., Spurzem, R., Bischof, H.-P. 2006, ApJ, 642, L21 [NASA ADS] [CrossRef] [Google Scholar]
- Berczik, P., Nitadori, K., Zhong, S., et al. 2011, International Conference on High Performance Computing, 8 [Google Scholar]
- Berczik, P., Spurzem, R., Zhong, S., et al. 2013, Lect. Notes Comput. Sci., 7905, 13 [Google Scholar]
- Berczik, P., Arca Sedda, M., Sobolenko, M., et al. 2022, A&A, 665, A86 [NASA ADS] [CrossRef] [EDP Sciences] [Google Scholar]
- Biava, N., Colpi, M., Capelo, P. R., et al. 2019, MNRAS, 1542 [Google Scholar]
- Binney, J., & Tremaine, S. 2008, Galactic Dynamics: Second Edition (Princeton, NJ: Princeton University Press) [Google Scholar]
- Böker, T., Sarzi, M., McLaughlin, D. E., et al. 2004, AJ, 127, 105 [CrossRef] [Google Scholar]
- Bortolas, E., Franchini, A., Bonetti, M., & Sesana, A. 2021, ApJ, 918, L15 [NASA ADS] [CrossRef] [Google Scholar]
- Capuzzo-Dolcetta, R. 1993, ApJ, 415, 616 [NASA ADS] [CrossRef] [Google Scholar]
- Colpi, M., Danzmann, K., Hewitson, M., et al. 2024, arXiv e-prints [arXiv:2402.07571] [Google Scholar]
- Davis, T. A., Nguyen, D. D., Seth, A. C., et al. 2020, MNRAS, 496, 4061 [NASA ADS] [CrossRef] [Google Scholar]
- De Looze, I., Baes, M., Parkin, T. J., et al. 2012, MNRAS, 423, 2359 [Google Scholar]
- Dehnen, W. 1993, MNRAS, 265, 250 [NASA ADS] [CrossRef] [Google Scholar]
- den Brok, M., Peletier, R. F., Seth, A., et al. 2014, MNRAS, 445, 2385 [NASA ADS] [CrossRef] [Google Scholar]
- Di Giovanni, M. 2025, arXiv e-prints [arXiv:2505.11033] [Google Scholar]
- Duffell, P. C., D’Orazio, D., Derdzinski, A., et al. 2020, ApJ, 901, 25 [NASA ADS] [CrossRef] [Google Scholar]
- Fahrion, K., Leaman, R., Lyubenova, M., & van de Ven, G. 2022, A&A, 658, A172 [NASA ADS] [CrossRef] [EDP Sciences] [Google Scholar]
- Franchini, A., Lupi, A., & Sesana, A. 2022, ApJ, 929, L13 [NASA ADS] [CrossRef] [Google Scholar]
- French, K. D., Wevers, T., Law-Smith, J., Graur, O., & Zabludoff, A. I. 2020, Space Sci. Rev., 216, 32 [CrossRef] [Google Scholar]
- Georgiev, I. Y., & Böker, T. 2014, MNRAS, 441, 3570 [Google Scholar]
- Gong, Y., Luo, J., & Wang, B. 2021, Nat. Astron., 5, 881 [NASA ADS] [CrossRef] [Google Scholar]
- Graham, M. J., Djorgovski, S. G., Stern, D., et al. 2015, Nature, 518, 74 [Google Scholar]
- Gualandris, A., & Merritt, D. 2012, ApJ, 744, 74 [NASA ADS] [CrossRef] [Google Scholar]
- Hernquist, L., & Ostriker, J. P. 1992, ApJ, 386, 375 [Google Scholar]
- Holley-Bockelmann, K., Khan, F. M., Williams, I., et al. 2025, ApJ, 995, L32 [Google Scholar]
- Iwasawa, M., An, S., Matsubayashi, T., Funato, Y., & Makino, J. 2011, ApJ, 731, L9 [NASA ADS] [CrossRef] [Google Scholar]
- Jülich Supercomputing Centre. 2021, J. Large-scale Res. Facil., 7 [Google Scholar]
- Just, A., Khan, F. M., Berczik, P., Ernst, A., & Spurzem, R. 2011, MNRAS, 411, 653 [Google Scholar]
- Khan, F. M., & Holley-Bockelmann, K. 2021, MNRAS, 508, 1174 [CrossRef] [Google Scholar]
- Khan, F. M., Just, A., & Merritt, D. 2011, ApJ, 732, 89 [Google Scholar]
- Khan, F. M., Preto, M., Berczik, P., Berentzen, I., Just, A., & Spurzem, R. 2012, ApJ, 749, 147 [NASA ADS] [CrossRef] [Google Scholar]
- Khan, F. M., Holley-Bockelmann, K., & Berczik, P. 2015, ApJ, 798, 103 [Google Scholar]
- Khan, F. M., Fiacconi, D., Mayer, L., Berczik, P., & Just, A. 2016, ApJ, 828, 73 [Google Scholar]
- Khan, F. M., Javed, F., Holley-Bockelmann, K., Mayer, L., Berczik, P., & Macciò, A. V. 2024, ApJ, 976, 22 [Google Scholar]
- Khan, F. M., Davis, B. L., Macciò, A. V., & Holley-Bockelmann, K. 2025, ApJ, 986, L1 [Google Scholar]
- Kormendy, J., & Ho, L. C. 2013, ARA&A, 51, 511 [Google Scholar]
- Li, B., Holley-Bockelmann, K., & Khan, F. M. 2015, ApJ, 811, 25 [Google Scholar]
- Liu, S., Wang, L., Hu, Y.-M., Tanikawa, A., & Trani, A. A. 2024, MNRAS, 533, 2262 [NASA ADS] [CrossRef] [Google Scholar]
- McCaffrey, J., Regan, J., Smith, B., et al. 2025, Open J. Astrophys., 8, 11 [Google Scholar]
- Merritt, D. 2006, ApJ, 648, 976 [NASA ADS] [CrossRef] [Google Scholar]
- Merritt, D. 2009, ApJ, 694, 959 [NASA ADS] [CrossRef] [Google Scholar]
- Merritt, D. 2013, Dynamics and Evolution of Galactic Nuclei (Princeton: Prince ton University Press) [Google Scholar]
- Milosavljević, M. 2004, ApJ, 605, L13 [Google Scholar]
- Molina, M., Reines, A. E., Latimer, L. J., Baldassare, V., & Salehirad, S. 2021, ApJ, 922, 155 [NASA ADS] [CrossRef] [Google Scholar]
- Mukherjee, D., Zhu, Q., Ogiya, G., Rodriguez, C. L., & Trac, H. 2023, MNRAS, 518, 4801 [Google Scholar]
- Mukherjee, D., Zhou, Y., Chen, N., Di Carlo, U. N., & Di Matteo, T. 2025, ApJ, 981, 203 [Google Scholar]
- Neumayer, N., Seth, A., & Böker, T. 2020, A&ARv, 28, 4 [Google Scholar]
- Nguyen, D. D., Seth, A. C., den Brok, M., et al. 2017, ApJ, 836, 237 [NASA ADS] [CrossRef] [Google Scholar]
- Nguyen, D. D., Seth, A. C., Neumayer, N., et al. 2018, ApJ, 858, 118 [NASA ADS] [CrossRef] [Google Scholar]
- Ogiya, G., Hahn, O., Mingarelli, C. M. F., & Volonteri, M. 2020, MNRAS, 493, 3676 [Google Scholar]
- Panamarev, T., Just, A., Spurzem, R., et al. 2019, MNRAS, 484, 3279 [NASA ADS] [CrossRef] [Google Scholar]
- Partmann, C., Naab, T., Rantala, A., et al. 2024, MNRAS, 532, 4681 [NASA ADS] [CrossRef] [Google Scholar]
- Partmann, C., Naab, T., Lahén, N., et al. 2025, MNRAS, 537, 956 [Google Scholar]
- Peters, P. C., & Mathews, J. 1963, Phys. Rev., 131, 435 [Google Scholar]
- Quinlan, G. D. 1996, New Astron., 1, 35 [Google Scholar]
- Rantala, A., & Naab, T. 2025, MNRAS, 542, L78 [Google Scholar]
- Rantala, A., Johansson, P. H., Naab, T., Thomas, J., & Frigo, M. 2018, ApJ, 864, 113 [Google Scholar]
- Rantala, A., Naab, T., & Lahén, N. 2024, MNRAS, 531, 3770 [NASA ADS] [CrossRef] [Google Scholar]
- Reines, A. E. 2022, Nat. Astron., 6, 26 [NASA ADS] [CrossRef] [Google Scholar]
- Rizzuto, F. P., Naab, T., Spurzem, R., et al. 2022, MNRAS, 512, 884 [NASA ADS] [CrossRef] [Google Scholar]
- Rizzuto, F. P., Naab, T., Rantala, A., et al. 2023, MNRAS, 521, 2930 [NASA ADS] [CrossRef] [Google Scholar]
- Sánchez-Janssen, R., Côté, P., Ferrarese, L., et al. 2019, ApJ, 878, 18 [CrossRef] [Google Scholar]
- Sathyaprakash, B., Abernathy, M., Acernese, F., et al. 2012, CQG, 29, 124013 [NASA ADS] [CrossRef] [Google Scholar]
- Sesana, A. 2010, ApJ, 719, 851 [Google Scholar]
- Sesana, A., & Khan, F. M. 2015, MNRAS, 454, L66 [Google Scholar]
- Seth, A. C., Cappellari, M., Neumayer, N., et al. 2010, ApJ, 714, 713 [NASA ADS] [CrossRef] [Google Scholar]
- Siwek, M., Weinberger, R., & Hernquist, L. 2023, MNRAS, 522, 2707 [NASA ADS] [CrossRef] [Google Scholar]
- Sobolenko, M., Kompaniiets, O., Berczik, P., et al. 2022, MNRAS, 517, 1791 [NASA ADS] [CrossRef] [Google Scholar]
- Souvaitzis, L., Rantala, A., & Naab, T. 2025, MNRAS, 539, 45 [Google Scholar]
- Spengler, C., Côté, P., Roediger, J., et al. 2017, ApJ, 849, 55 [NASA ADS] [CrossRef] [Google Scholar]
- Sturm, M. R., & Reines, A. E. 2024, ApJ, 971, 173 [NASA ADS] [CrossRef] [Google Scholar]
- Tremaine, S. D., Ostriker, J. P., & Spitzer, L., Jr. 1975, ApJ, 196, 407 [NASA ADS] [CrossRef] [Google Scholar]
- Vasiliev, E. 2019, MNRAS, 482, 1525 [Google Scholar]
- Vergara, M. C., Schleicher, D. R. G., Escala, A., et al. 2024, A&A, 689, A34 [NASA ADS] [CrossRef] [EDP Sciences] [Google Scholar]
- Vergara, M. C., Askar, A., Kamlah, A. W. H., et al. 2025, A&A, 704, A321 [NASA ADS] [CrossRef] [EDP Sciences] [Google Scholar]
- Yao, Y., Chornock, R., Ward, C., et al. 2025, ApJ, 985, L48 [Google Scholar]
- Zhou, Y., Mukherjee, D., Chen, N., et al. 2025, ApJ, 980, 79 [Google Scholar]
https://www.et-gw.eu/, Einstein Telescope (ET).
https://lisa.nasa.gov, LISA.
All Tables
All Figures
|
Fig. 1. Volume density profiles of individual stellar (NSC) and BH (BW) components (top panel) and cumulative mass profiles of the same (bottom panel) for NGC205 NSC + BW model. The full lines represent initial profiles for the BH and stellar components, and dashed lines represent the same (in corresponding colors) at designated times in Myr. The vertical brown line represents the sphere of influence (rinfl1) of the IMBH for initial distribution, and the vertical gray line showcases the effective radius of the NSC. |
| In the text | |
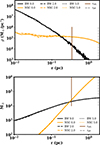 |
Fig. 2. Same as in Fig. 1, but this time for the NGC404 NSC + BW model. |
| In the text | |
|
Fig. 3. IMBH pair and binary evolution in NGC205 models with (blue colors) and without (red color) a central BH cusp for a 1:4 IMBH mass ratio. The IMBH binary evolution in simulation performed with ϕ−GPU hybrid code is labeled as “hybrid”. Top panel: IMBHs orbit relative separation (ΔRbh). Middle panel: IMBHs orbit inverse semimajor axis (1/a). Bottom panel: IMBH binaries eccentricity (e). |
| In the text | |
|
Fig. 4. IMBH binary hardening rates, s, at various times for all of our runs. |
| In the text | |
|
Fig. 5. Density profiles for NGC205 models with 1:4 mass ratio. Top panel: Density profile of stellar components in NSC + BW and NSC models. The 00 line is the initial stellar profile, which is the same for both models. Thick and thin vertical brown lines are influence radii at the start and end of our NSC + BW model run, respectively. The different lines are density profiles of the designated models at the labeled 1/a value of the IMBH binary. Bottom panel: Density profile of stellar (ST) and black hole (BH) components in the NSC + BW model. The full lines are initial profiles and dashed or dotted lines are profiles at designated values of 1/a for stellar (orange color) and BH component (black color). |
| In the text | |
|
Fig. 6. Cumulative mass profiles (in solar masses) of the BHs (top panel) and stellar distribution (bottom panel) for the NGC205 model with BH component for 1:4 mass ratio at various times during IMBH binary evolution. Thick and thin vertical brown lines are the initial and final values of the influence radius, respectively, and the vertical gray line is the initial effective radius of NSC. |
| In the text | |
|
Fig. 7. Evolution of the logarithmic density slope parameter γ for NGC205 with 1:4 mass ratio. γ was calculated by fitting and averaging over the nine snapshots in a timespan of ≈0.1 Myr. The errors of the averaging are less than one percent. The color coding represents three different components: BHs (black), stars (orange), and all particles (red). The top panel shows the γ for the first 3.5 Myr of the evolution, whereas bottom panel shows the same for full-time evolution. The gray zone in the top panel indicates the IMBH binary formation to a hard binary transition time. Dashed horizontal lines show ρ(r) relations for various power indices, including the BW cusp. |
| In the text | |
|
Fig. 8. Relaxation time as a function of distance from the center at initial time (top panel) and at final time T = 34.5 Myr (bottom panel) for NGC205 with 1:4 mass ratio IMBHs. The relaxation time was calculated using the relation from Binney & Tremaine (2008). The color coding is for the three different components: BHs (black), stars (orange), and all particles (red). |
| In the text | |
|
Fig. 9. Velocity dispersion profiles of BHs and stellar components for the NGC205 model with 1:4 mass ratio IMBHs at different times for labeled values of 1/a. |
| In the text | |
|
Fig. 10. Distribution of particles final ejection direction by the IMBH binary on the timescale T = 2–8 Myr for NGC205 with 1:4 mass ratio. The color code is time in the left panel and the number of particles in each bin in the right panel. Black (left) and red (right) crosses on the plots’ top are the IMBH binary angular momentum direction. The asymmetry in positive and negative θ directions is at the level ≈40%. Particles generally are ejected in the direction of the IMBH binary orbital plane for a chosen time interval. |
| In the text | |
|
Fig. 11. IMBH binary parameter evolution for NGC205 model with 1:4 mass ratio IMBHs. Top panel: Inverse semimajor axis of IMBH binaries in our simulation (full lines) and its estimated evolution (dashed and dotted lines) taking into account energy loss through GW emission. The evolution is estimated using different values of s for the NSC + BW model. Bottom panel: Eccentricity of IMBH binaries in our simulation. The line and color scheme is the same as employed for 1/a plot in top panel. |
| In the text | |
|
Fig. 12. Top panel: IMBH binary inverse semimajor axis in our simulation (full lines), and its estimated evolution (dashed lines) for NGC205 models with 1:40 mass ratio IMBHs. Bottom panel: Eccentricity evolution of IMBH binaries. |
| In the text | |
|
Fig. 13. IMBH pair and binary evolution in NGC404 models (with and without a central BH cusp). Top panel: IMBH orbit relative separation (ΔRBH). Middle panel: IMBH binaries orbit inverse semimajor axis (1/a). Bottom panel: IMBH binaries eccentricity (e). |
| In the text | |
|
Fig. 14. Density profile for NGC404 model. Top panel: Density profile of stellar and BH components in NSC + BW before and after a hard binary forms. Bottom panel: Time evolution of stellar and BH component density profile in the late phase of IMBH binary evolution. |
| In the text | |
|
Fig. 15. Relaxation time at various distances from the center at initial time (top panel) and at final time T = 27.5 Myr (bottom panel) for NGC404. Relaxation time was calculated using Binney & Tremaine (2008). The color coding is the three different components: BHs (black), stars (orange), and all particles (red). |
| In the text | |
|
Fig. 16. Evolution of the inner logarithmic density slope parameter γ for NGC404 NSC + BW run. The parameter γ was calculated by fitting and averaging over the nine snapshots in a time span of ≈0.1 Myr. The errors of the averaging are less than one percent. The color coding represents three different components: BHs (black), stars (orange), and all particles (red). |
| In the text | |
|
Fig. 17. Total energy of the whole system (blue), stellar component (orange), BH component (black), and IMBH binary (brown) for the whole duration of our simulation for the NGC404 NSC + BW run. |
| In the text | |
|
Fig. 18. Density changes as a function of time (in Myr) induced by IMBH binary in BH component in the absence of a stellar mass distribution (realized as an external potential) for the NGC404 NSC + BW run. |
| In the text | |
|
Fig. 19. Inverse semimajor axis of IMBH binaries in our simulation (full lines) and its estimated evolution (dashed lines) for the NGC404 NSC + BW model. |
| In the text | |
Current usage metrics show cumulative count of Article Views (full-text article views including HTML views, PDF and ePub downloads, according to the available data) and Abstracts Views on Vision4Press platform.
Data correspond to usage on the plateform after 2015. The current usage metrics is available 48-96 hours after online publication and is updated daily on week days.
Initial download of the metrics may take a while.