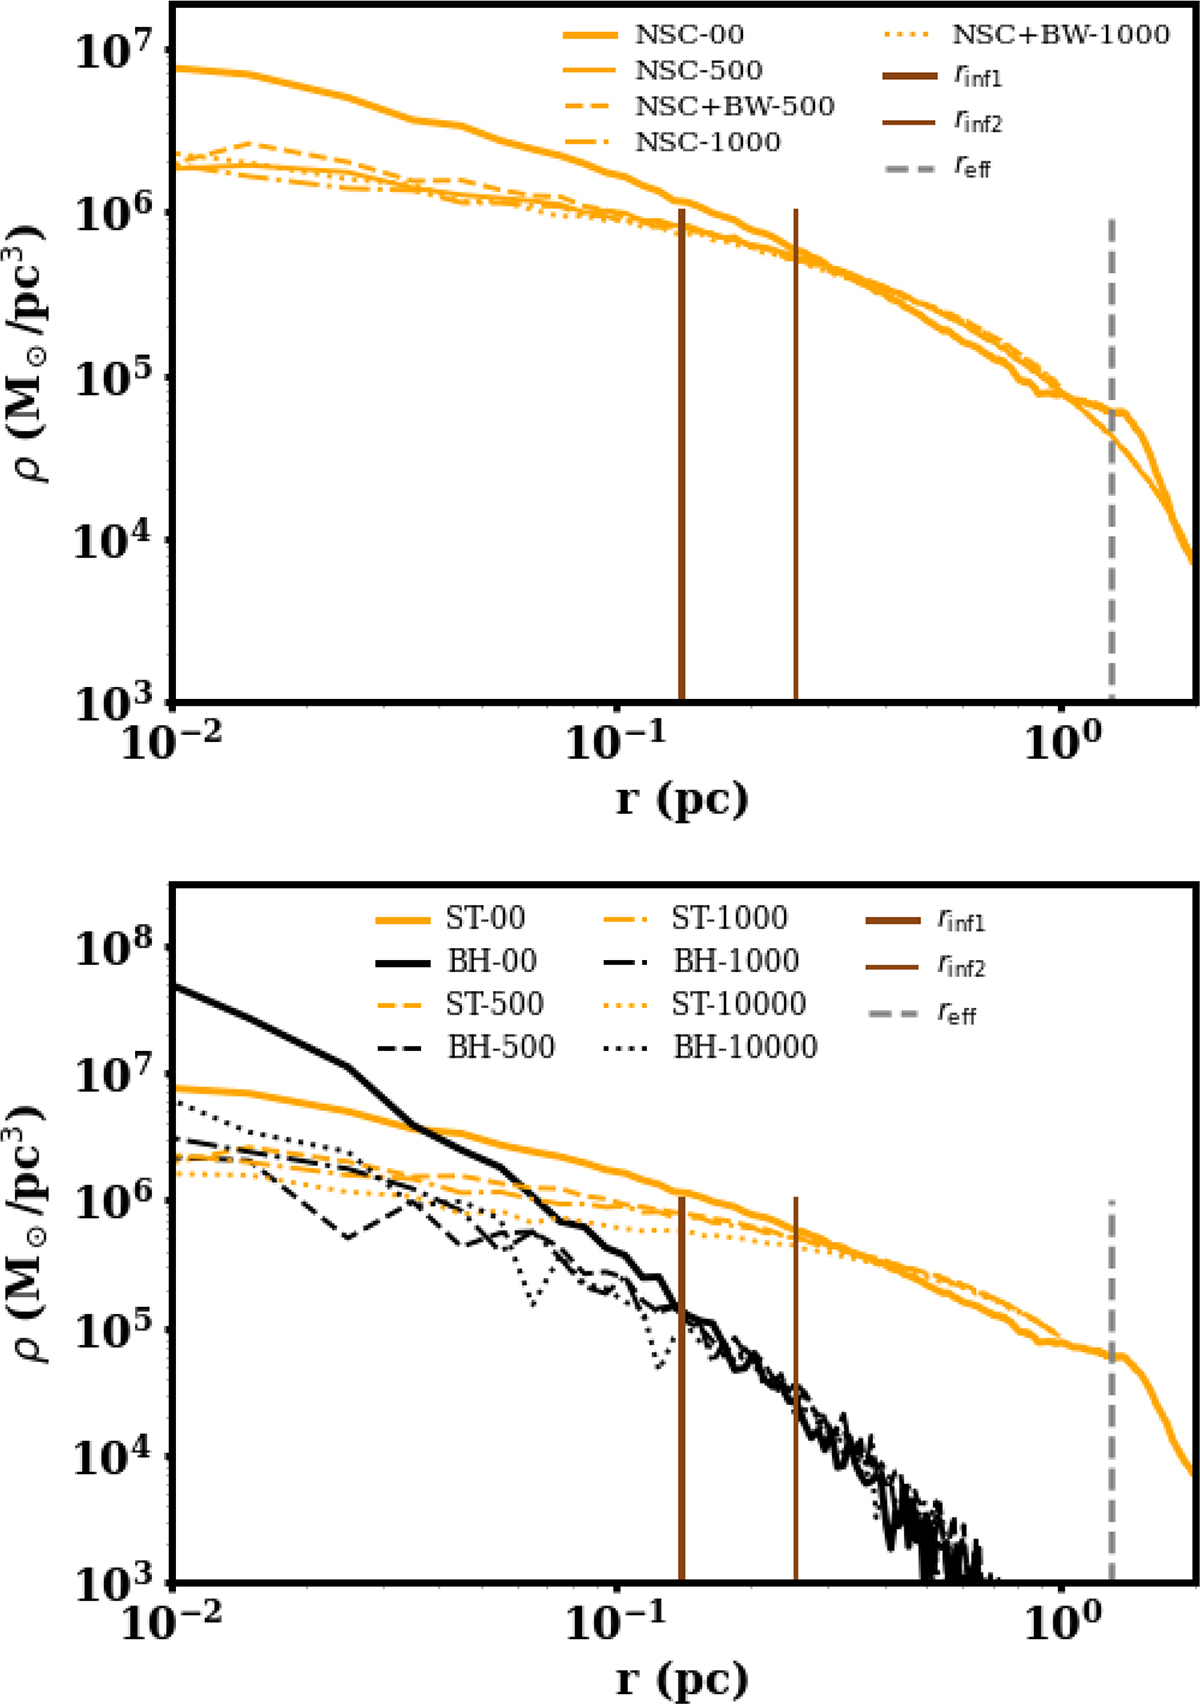
Fig. 5.
Download original image
Density profiles for NGC205 models with 1:4 mass ratio. Top panel: Density profile of stellar components in NSC + BW and NSC models. The 00 line is the initial stellar profile, which is the same for both models. Thick and thin vertical brown lines are influence radii at the start and end of our NSC + BW model run, respectively. The different lines are density profiles of the designated models at the labeled 1/a value of the IMBH binary. Bottom panel: Density profile of stellar (ST) and black hole (BH) components in the NSC + BW model. The full lines are initial profiles and dashed or dotted lines are profiles at designated values of 1/a for stellar (orange color) and BH component (black color).
Current usage metrics show cumulative count of Article Views (full-text article views including HTML views, PDF and ePub downloads, according to the available data) and Abstracts Views on Vision4Press platform.
Data correspond to usage on the plateform after 2015. The current usage metrics is available 48-96 hours after online publication and is updated daily on week days.
Initial download of the metrics may take a while.