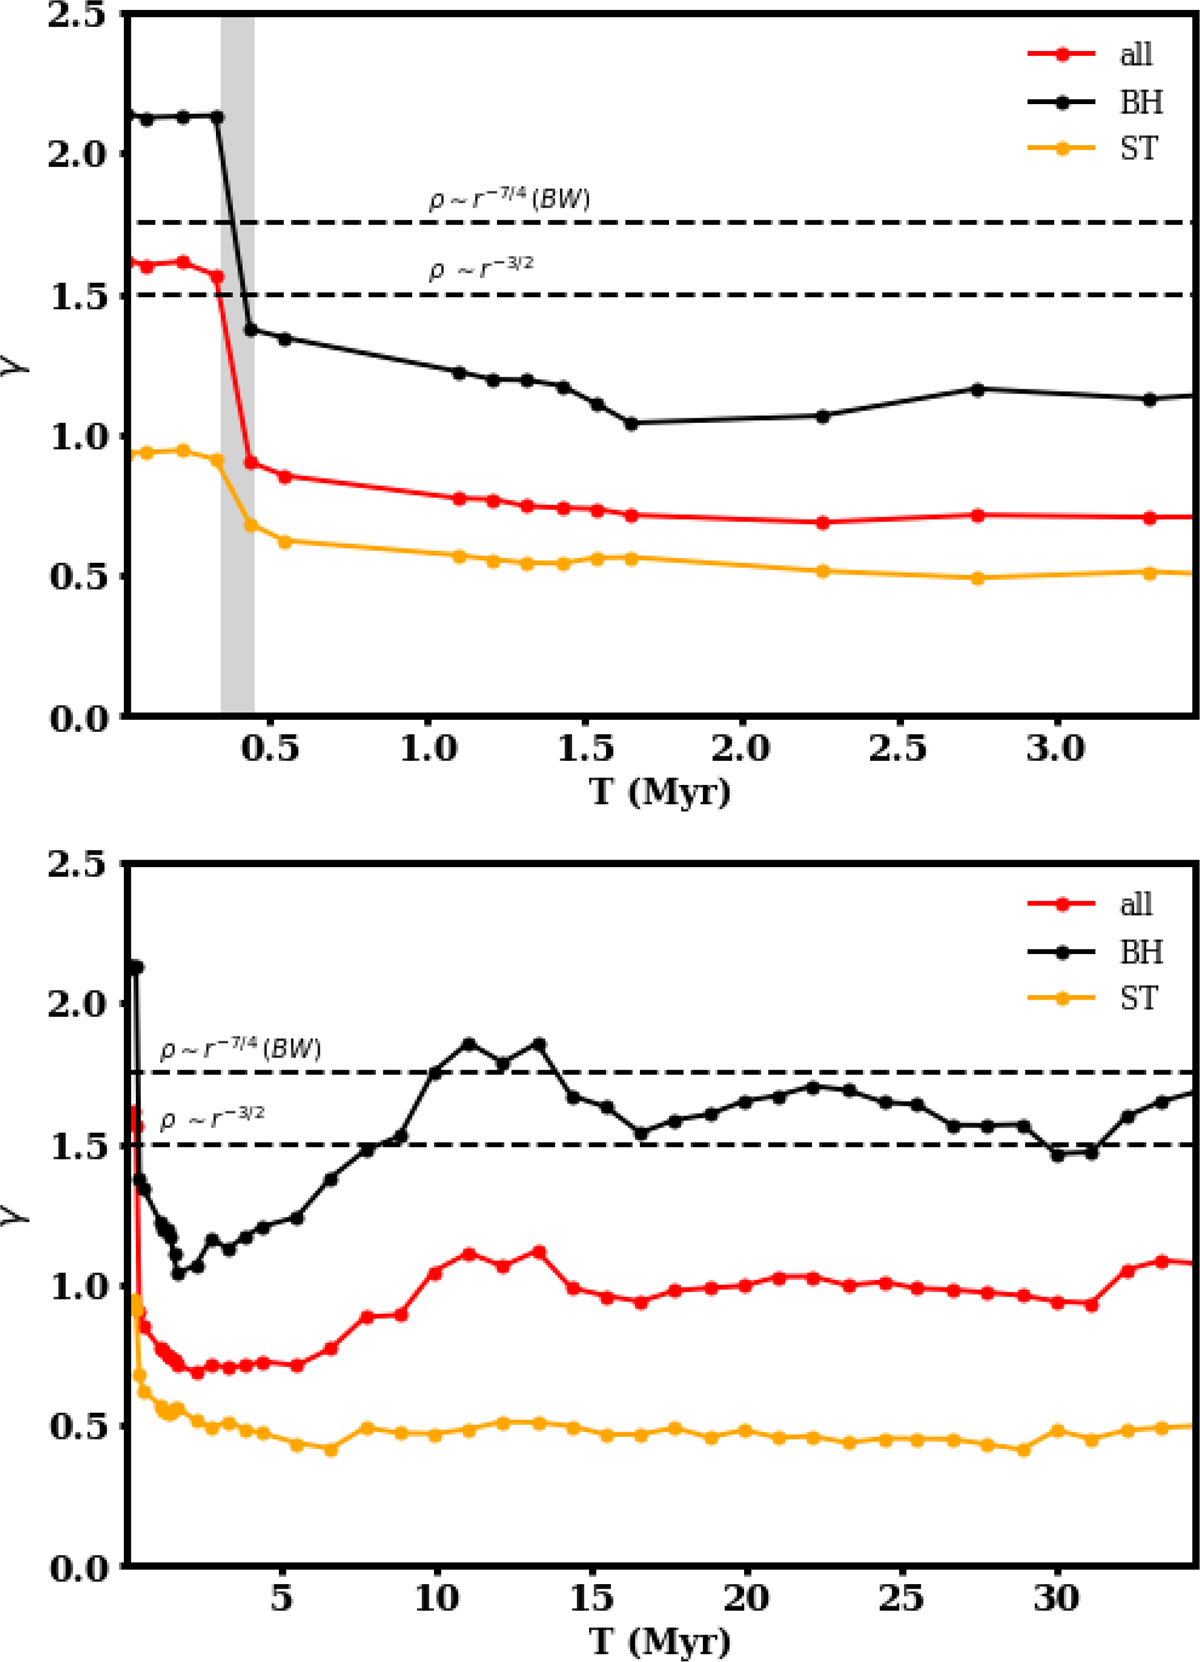
Fig. 7.
Download original image
Evolution of the logarithmic density slope parameter γ for NGC205 with 1:4 mass ratio. γ was calculated by fitting and averaging over the nine snapshots in a timespan of ≈0.1 Myr. The errors of the averaging are less than one percent. The color coding represents three different components: BHs (black), stars (orange), and all particles (red). The top panel shows the γ for the first 3.5 Myr of the evolution, whereas bottom panel shows the same for full-time evolution. The gray zone in the top panel indicates the IMBH binary formation to a hard binary transition time. Dashed horizontal lines show ρ(r) relations for various power indices, including the BW cusp.
Current usage metrics show cumulative count of Article Views (full-text article views including HTML views, PDF and ePub downloads, according to the available data) and Abstracts Views on Vision4Press platform.
Data correspond to usage on the plateform after 2015. The current usage metrics is available 48-96 hours after online publication and is updated daily on week days.
Initial download of the metrics may take a while.