Open Access
Fig. 3.
Download original image
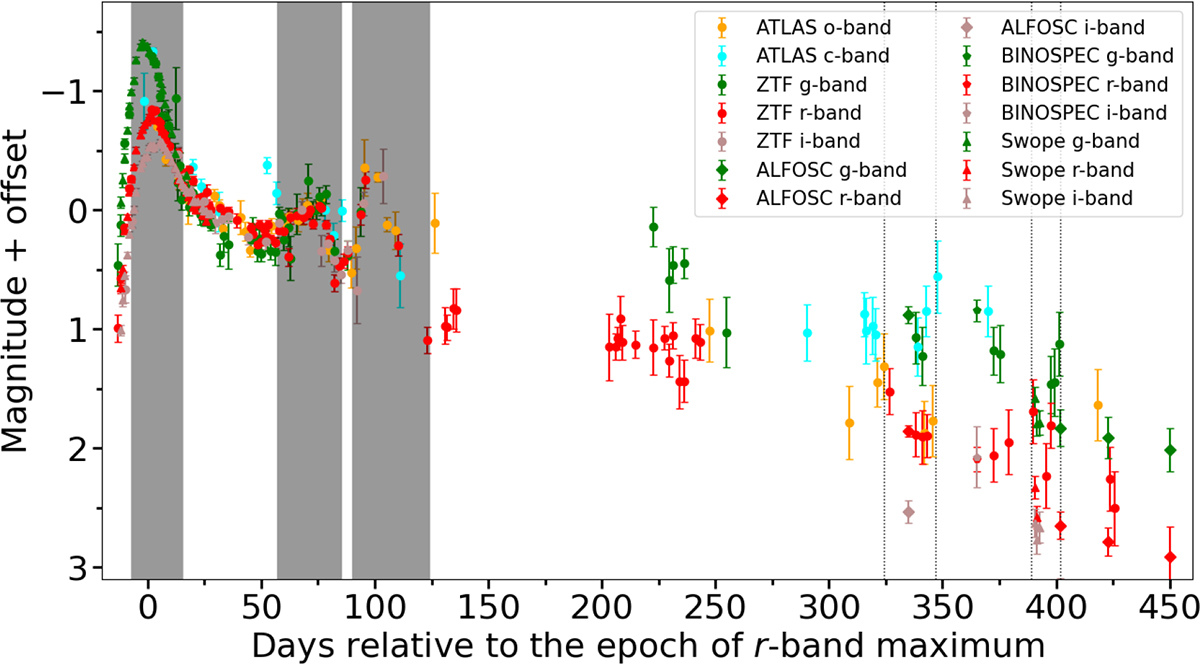
Light curves of SN 2021efd with shifted magnitudes so that the second peaks match roughly. The shaded areas highlight the clear bumps at +0 days, ∼ + 75 days, and ∼ + 105 days. The dotted lines mark the possible later bumps at ∼ + 325 days, ∼ + 345 days, ∼ + 390 days, and ∼ + 400 days.
Current usage metrics show cumulative count of Article Views (full-text article views including HTML views, PDF and ePub downloads, according to the available data) and Abstracts Views on Vision4Press platform.
Data correspond to usage on the plateform after 2015. The current usage metrics is available 48-96 hours after online publication and is updated daily on week days.
Initial download of the metrics may take a while.