Open Access
Fig. 5.
Download original image
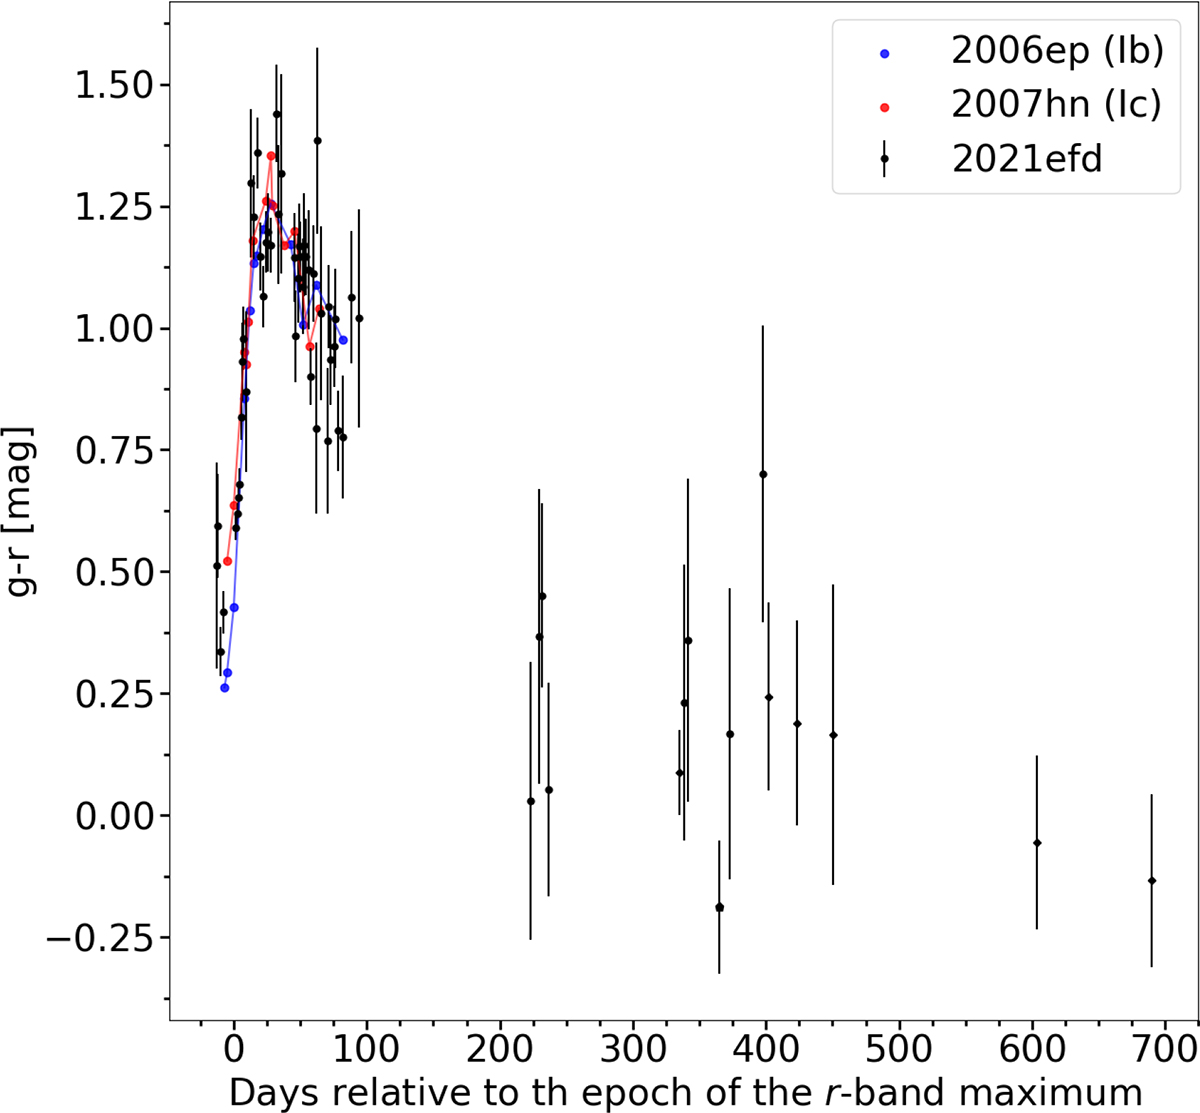
g − r color evolution. The black dots show the evolution of SN 2021efd. The circles, diamonds, and pentagons correspond to ZTF, ALFOSC, and Binospec data, respectively. The blue line represents the color evolution of the Type Ib SN 2006ep, and the red line represents the Type Ic 2007hn presented in Stritzinger et al. (2018)
Current usage metrics show cumulative count of Article Views (full-text article views including HTML views, PDF and ePub downloads, according to the available data) and Abstracts Views on Vision4Press platform.
Data correspond to usage on the plateform after 2015. The current usage metrics is available 48-96 hours after online publication and is updated daily on week days.
Initial download of the metrics may take a while.