Open Access
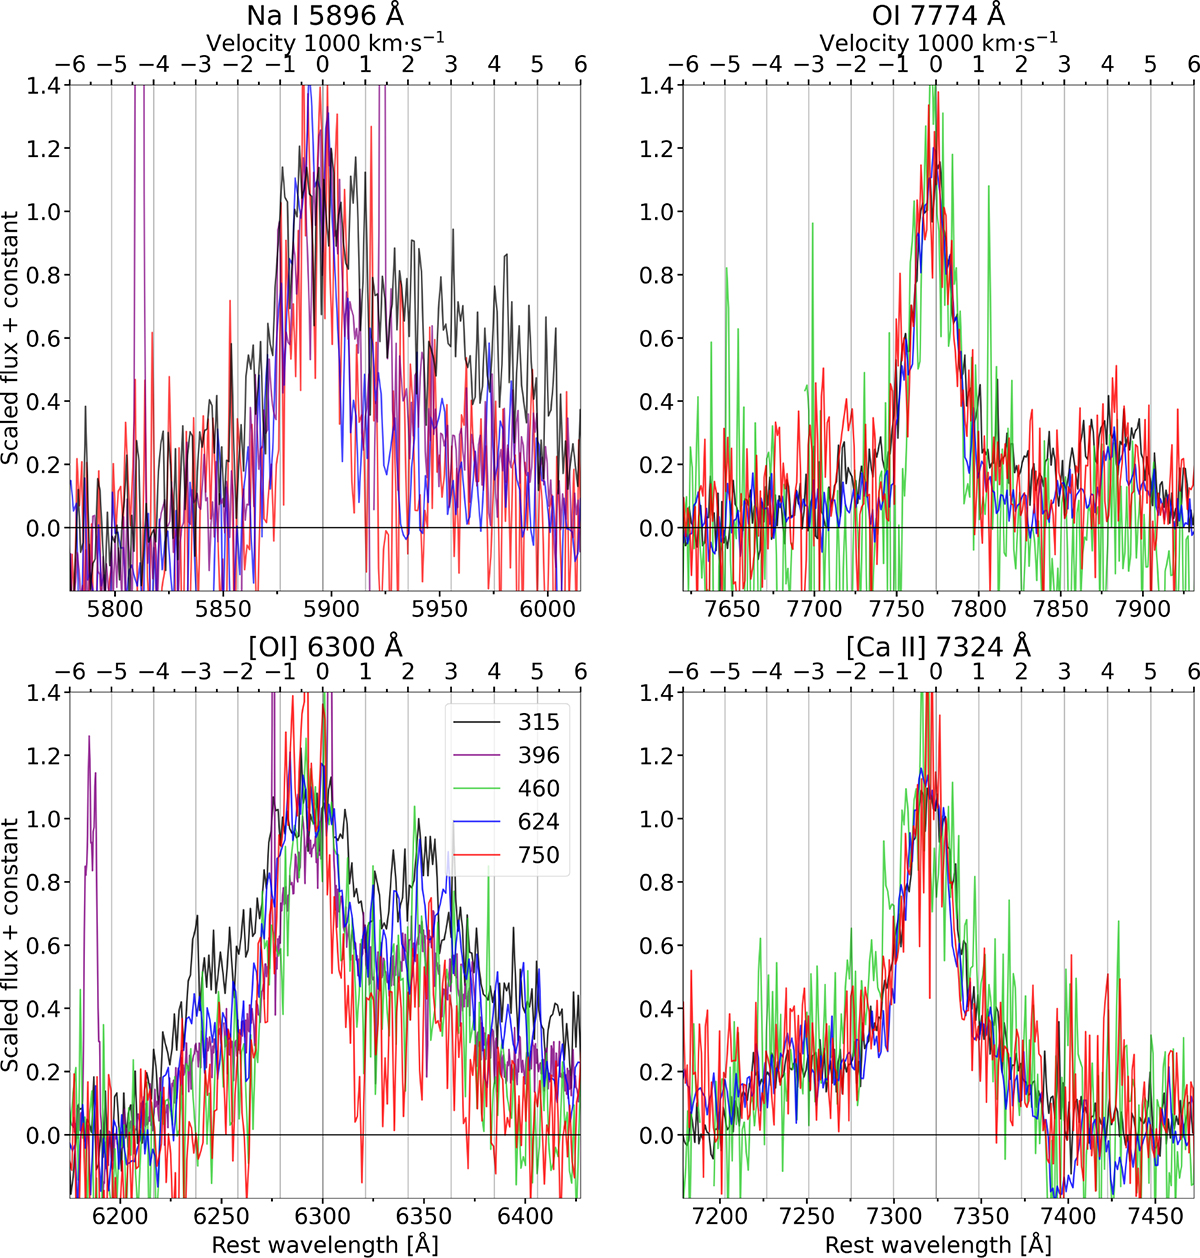
Fig. 9.
Download original image
Line profiles of the nebular spectra. Some epochs are excluded for clarity. The rest wavelength of what appears to be the strongest line is displayed as the zero point of velocity.
Current usage metrics show cumulative count of Article Views (full-text article views including HTML views, PDF and ePub downloads, according to the available data) and Abstracts Views on Vision4Press platform.
Data correspond to usage on the plateform after 2015. The current usage metrics is available 48-96 hours after online publication and is updated daily on week days.
Initial download of the metrics may take a while.