Fig. A.1
Download original image
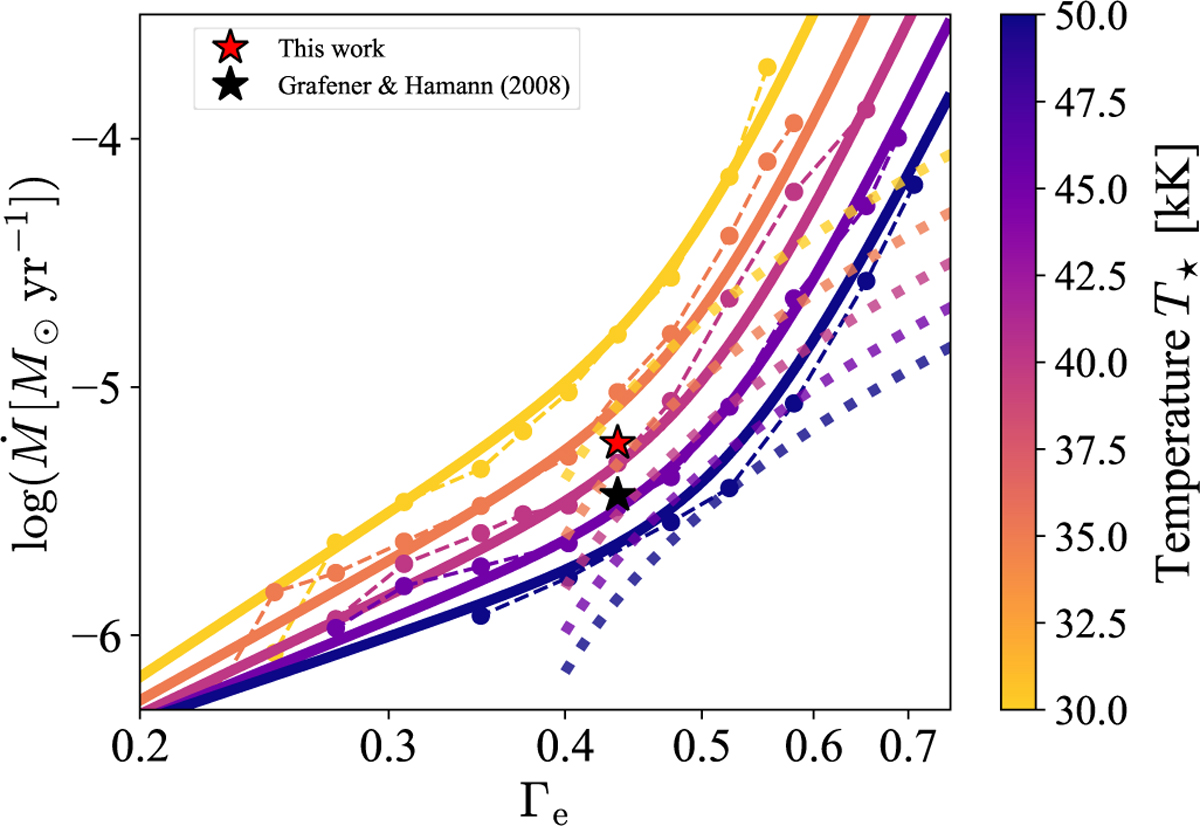
Mass-loss rate versus the classical Eddington parameter Γe, comparing our predictions with those of Gräfener & Hamann (2008). Our model predictions are indicated by coloured symbols connected with dashed lines. The best-fit relation from Eq (10) is shown as solid lines, while the fit from Gräfener & Hamann (2008) is shown as dotted lines. Absolute mass-loss rates predicted by the two fits for M* = 60 M⊙ and T* = 38 kK are indicated by red and black star symbols, respectively.
Current usage metrics show cumulative count of Article Views (full-text article views including HTML views, PDF and ePub downloads, according to the available data) and Abstracts Views on Vision4Press platform.
Data correspond to usage on the plateform after 2015. The current usage metrics is available 48-96 hours after online publication and is updated daily on week days.
Initial download of the metrics may take a while.