Open Access
Fig. 9
Download original image
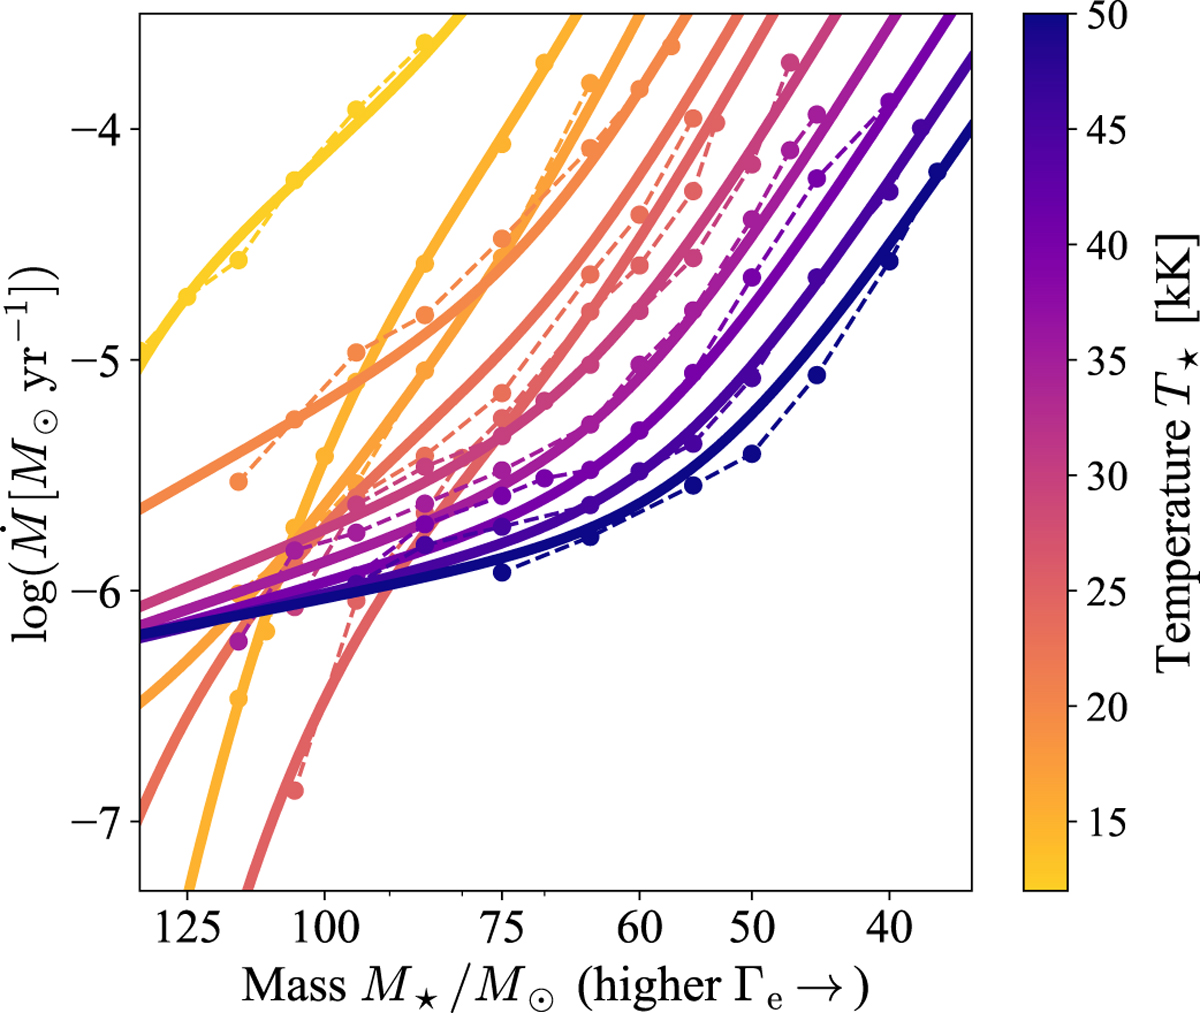
PoWRHD predicted mass-loss rates (symbols with dashed lines) compared to our best-fit relation (solid lines) as functions of stellar mass, M*. The fit derives from Eq. (10), with lines colour-coded by stellar temperature, T*.
Current usage metrics show cumulative count of Article Views (full-text article views including HTML views, PDF and ePub downloads, according to the available data) and Abstracts Views on Vision4Press platform.
Data correspond to usage on the plateform after 2015. The current usage metrics is available 48-96 hours after online publication and is updated daily on week days.
Initial download of the metrics may take a while.