Fig. 11
Download original image
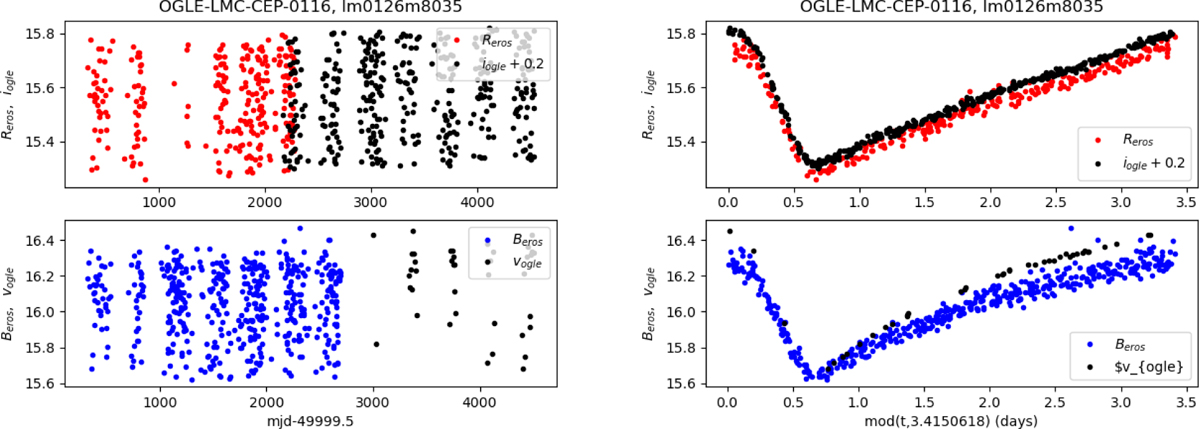
Light curve of a Cepheid variable star with a period of ~3.4 days, as seen by EROS-2and OGLE. The left plots show the magnitude measurements as a function of time in days (mjd - 49999.5) over more than ten years, and the right plots show the magnitude measurements folded over a single period. The top plots show the measurements in the Reros and Iogle bands, and Beros and Vogle are shown in the bottom panels. OGLE data for this Cepheid were obtained from https://ogledb.astrouw.edu.pl/~ogle/OCVS/.
Current usage metrics show cumulative count of Article Views (full-text article views including HTML views, PDF and ePub downloads, according to the available data) and Abstracts Views on Vision4Press platform.
Data correspond to usage on the plateform after 2015. The current usage metrics is available 48-96 hours after online publication and is updated daily on week days.
Initial download of the metrics may take a while.