| Issue |
A&A
Volume 706, February 2026
|
|
|---|---|---|
| Article Number | A189 | |
| Number of page(s) | 15 | |
| Section | Catalogs and data | |
| DOI | https://doi.org/10.1051/0004-6361/202557321 | |
| Published online | 12 February 2026 | |
EROS light-curve database
1
IRFU, CEA, Universite de Paris-Saclay, CEA, Irfu,
91191
Gif-sur-Yvette,
France
2
Université Paris-Saclay, CNRS/IN2P3, IJCLab,
91405
Orsay,
France
3
Université Paris-Saclay, Université Paris Cité, CEA, CNRS, AIM,
91191
Gif-sur-Yvette,
France
4
Université de Paris, CNRS, Astroparticule et Cosmologie,
75013
Paris,
France
5
Sorbonne Universités, UPMC Univ Paris 6 et CNRS, UMR 7095, Institut d’Astrophysique de Paris, IAP,
75014
Paris,
France
6
Université de Strasbourg, CNRS, Observatoire Astronomique, CNRS,
UMR 7550,
67000
Strasbourg,
France
7
Sorbonne Université, CNRS/IN2P3, Laboratoire de Physique Nucléaire et de Hautes Énergies (LPNHE),
75005
Paris,
France
★ Corresponding author: This email address is being protected from spambots. You need JavaScript enabled to view it.
Received:
19
September
2025
Accepted:
5
December
2025
Abstract
Context. The project called Expérience de Recherche d’Objets Sombres (EROS) carried out photometric surveys of dense stellar fields toward the Magellanic Clouds (LMC and SMC), the Galactic bulge and Galactic spiral arms in the period 1990-2003. The main goal of the experiment was to search for the Galactic dark matter in the form of massive compact objects (machos) through the gravitational microlensing effect.
Aims. The historical record of the flux variations in the monitored stars by EROS-2 will be a unique asset for time-domain astronomy and to complement current and future searches of transient sources.
Methods. We describe the set of light curves that was obtained with the EROS-2 program from 1996 to 2003, when more than 86 million stars were monitored. The set is publicly released through the Centre de Données de Strasbourg (CDS). This dataset includes 28.7 and 4.0 million light curves in the LMC and SMC, 42.9 million light curves in the Galactic bulge, and 10.4 million light curves toward the Galactic spiral arms and has several hundred measurements for each object. The data from EROS-1 are also being released.
Results. The object catalog, light curves, and images are accessible through the CDS portal. This is useful for determining the past behavior of newly discovered variable objects.
Key words: catalogs / surveys
© The Authors 2026
 Open Access article, published by EDP Sciences, under the terms of the Creative Commons Attribution License (https://creativecommons.org/licenses/by/4.0), which permits unrestricted use, distribution, and reproduction in any medium, provided the original work is properly cited.
This article is published in open access under the Subscribe to Open model. This email address is being protected from spambots. You need JavaScript enabled to view it. to support open access publication.
1 Introduction
The project called Expérience de Recherche d’Objets Sombres (EROS1) started in 1990 (Aubourg et al. 1993b) with the aim of searching for massive compact objects (machos), such as brown dwarfs or black holes that are thought to make up a significant fraction of the Milky Way dark matter halo. The project was inspired by the suggestion of B. Paczynski in 1986 (Paczynski 1986) that machos might reveal their presence through the gravitational microlensing effect that acts on background stars. The name microlensing was coined by B. Paczynski to emphasize on the tiny angular separation of a fraction of a milliarcsecond between multiple images. It can be observed as a transient magnification of the background star, however, due to the relative observer-lens-star motion. For how long the brightness of the transient star increases depends on the geometric configuration and scales with the square root of the lens mass. It is typically 70 days for 1 M⊙ lenses in the halo of the Milky Way and for sources in the Magellanic clouds.
The two phases of EROS, EROS-1 and EROS-2, observed the Magellanic clouds from the European Southern Observatory (ESO) at La Silla, Chile, from 1991 to 2003. Two other microlensing projects were initiated nearly simultaneously with EROS: the MACHO2 project, which observed from Mount Stromlo in Australia, and the OGLE3 project, which observed from the Las Campanas observatory in Chile. The first candidate events were announced by the three projects in 1993 (Alcock et al. 1993; Aubourg et al. 1993a; Udalski et al. 1993). These three microlensing projects were later joined by the MOA project (Sumi et al. 2003), which primarily focused on the search for planetary systems through their microlensing effect and led to a first planet candidate reported by Bond et al. (2004).
After 5.7 years of observations, the MACHO collaboration reported a significant number of events toward the central regions of the Large Magellanic Cloud (LMC) (Alcock et al. 2000), which was interpreted as being due to ~0.5 M⊙ machos, which make up ~20% of the total standard halo mass. Subsequent results from EROS (Tisserand et al. 2007) and OGLE (Wyrzykowski et al. 2011) cast doubt on the interpretation of the MACHO events as due to halo objects by limiting the macho mass fraction of the halo to less than ~10% in the macho mass range of 10−6 to 10 M⊙. A new analysis based on a combined dataset of EROS and MACHO light curves extended these limits to 1000 M⊙ (Blaineau et al. 2022). More recently, the OGLE results have further lowered these limits to the 1% level (Mróz et al. 2024c,a,b, 2025).
The first phase of EROS, EROS-1, observed the Magellanic clouds between 1991 and 1995 in two complementary instrumental setups. The first setup used ESO Schmidt photographic plates to search for events that lasted more than a few days. The final results of this program were presented by Ansari et al. (1996). The second setup used the T40 telescope with its aperture of 40 cm, which was equipped with the EROS-1 CCD camera to search for events with durations as short as one hour (Arnaud et al. 1994a,b). The final results of this program were presented by Renault et al. (1998).
The second phase, EROS-2, observed between 1996 and 2003. It used the 1-meter Marseille-Lyon (MARLY) telescope, which is equipped with two CCD cameras, each with 64 million pixels, to perform a systematic survey from 1996 to 2003 of seven targets that we list in Table 1: the two Magellanic clouds (LMC and SMC), the Galactic center (CG), and four regions in the direction of Galactic spiral arms (βSct, γSct, γNor, and θMus). The final microlensing results based on bright stars in the LMC and SMC were presented by Tisserand et al. (2007). The results for the Galactic center using clump giants were presented by Hamadache et al. (2006). The optical depth toward the spiral arms was given by Rahal et al. (2009).
In this paper, we present the EROS-2 catalogs and light curves of 85 million stars, including variable stars and faint stars that were not used to measure the optical depth. The catalogs are being made public through the Centre de Données astronomiques de Strasbourg (CDS)4, so that they can be consulted by ongoing or future major survey programs, such as the Legacy Survey of Space and Time (LSST)5, to determine the history of transient objects that will be discovered. Brokers such as Fink6 (Möller et al. 2021) will also be able to use the EROS light-curve database to confirm or discard alerts, particularly in the search for microlensing events.
The paper is organized as follows: The EROS-2 instrument and observing program are presented in Section 2, and the image-processing pipeline is described in Section 3. The data quality is discussed in Section 4. The characteristics of the public dataset are given in Section 5 with the detailed data structure, illustrated in Fig. A.1, given in Appendix A. The EROS-2 images that are released are described in Appendix B. The EROS-1-CCD data that are made public are briefly described in Appendix C and those of the EROS-1 Schmidt-plate program in Appendix D.
Main characteristics of the EROS microlensing targets.
2 EROS-2 program
2.1 The instrument
We briefly describe the EROS-2 telescope and camera. A detailed presentation of the instrument, telescope operations and data reduction can be found in in Bauer & de Kat (1998), Bauer & de Kat (1997), and Bauer (1997) and references therein.
The EROS-2 project used a 96 cm Ritchey-Chrétien telescope named MARLY. The telescope was originally designed and built in 1970 by the Observatoire de Marseille and Observatoire de Lyon. It was refurbished and installed in the Grand Prism Objectif (GPO) dome in the ESO La Silla observatory in Chile in 19957. Figure 3 shows the telescope with the two EROS cameras. The telescope was equipped with a focal reducer and field corrector that decreased the focal ratio from f/8 to f/5 to increase the field of view. This led to a focal length f = 5.14 m. A dichroic beam-splitter was also installed with a separation around the Hα line at 656 nm that divided the incoming light between a blue and a red arm, each equipped with a camera with a wide field of view of ~1 deg2.
Each camera had an array of four times two (i.e., eight) CCDs, with the four adjacent CCDs aligned with the declination axis. The CCD sensors had 2048 x 2048 pixels with a size of 15 × 15 μm2, corresponding to 0.602 × 0.602 arcsec2. The mosaic of eight CCDs in each camera, with a total of 32 million pixels (8K × 4K), covered an area of 120 × 60 mm2 on the focal plane. This corresponds to 0.7° × 1.4° on the sky. The threesided buttable 2K × 2K Loral8 2K3eb CCDs were packaged at the Steward Observatory (University of Arizona), and were then tested and assembled into the two mosaics at the CEA DAPNIA Institute (IRFU today) in Saclay, France. The wavelength passband including the CCD quantum efficiency was 400-735 nm for the blue camera and 550-950 nm for the red camera. The CCD mosaics were cooled down to 180 K in two vacuum vessels using a He Edwards cryocooler. Photographs of one of the cryostats and a closeup view of its mosaic are shown in Figure 4.
The CCD clocking and readout was handled by a custom-designed electronic system and achieved a per-pixel RMS noise of 6-7 electrons. The Versa-Module Europe (VME) based acquisition system was equipped with memory management boards (MMB) and controlled the parallel readout of the two cameras, with a readout time of 50 seconds. The image data were then transferred to unix (DEC-OSF) acquisition computers through the Ethernet network and were then saved as FITS files. Each exposure produced 2 × 64MB or 128 megabytes of data, representing a total of 6-8 gigabyte image data per night.
An automatic telescope pointing and guiding system was designed by Laboratoire de l’Accélerateur Linéaire (LAL, CNRS/IN2P3) in Orsay, now IJCLab. The system featured a custom-designed control and supervisor software that ran on a standard PC with Linux operating system; its operation and performances were monitored remotely from France. The telescope angular positions on the two rotation axes were obtained through commercially available on-axis absolute encoders and associated read-out electronics, and each axis was also equipped with precision electrical motors that were driven by a motion-control board with PID filters to produce the necessary torque to move the telescope. The dome positioning was also automatic and piloted by the same software. Finally, this system used a 1600 × 800 pixel CCD camera and observed a small sky area that was selected on the side of the field of view of the main cameras by especially designed optics. The system was able to move the telescope to the specified sky coordinates and find and lock the guide star while the CCD mosaics was being read out. This introduced the shortest possible dead time during the intensive observations. The choice of a CCD camera for the EROS-2 guiding system was motivated by Mansoux (1997), who studied the performance of the system for the CCD camera and compared it to that of an intensified camera.
The exposures were first processed for quality checks at the dome using a cluster of three DEC9 Alpha 600 computers. The data were stored on DLT tapes and sent to the CC-IN2P3 (Centre de Calcul de l'IN2P3) in France.
Images were taken simultaneously in two wide passbands, Reros centered close to the IC standard band, and Beros, which is intermediate between the standard VJ and RC bands. The calculated passbands of the two arms are shown in Fig. 5. After the EROS survey was completed, almost all of our Magellanic fields could be calibrated using stars from the catalogs of the Magellanic Clouds Photometric Survey (Zaritsky et al. 2004). For 4.5 deg2, the calibration was confirmed with the OGLE-II catalog (Udalski et al. 2000). To a precision of ~0.1 mag, the EROS magnitudes satisfy
 (1)
(1)
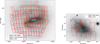 |
Fig. 1 EROS LMC (left) and SMC (right) fields superimposed on images of the full Gaia-dr3 catalog numbers counts (Gaia Collaboration 2023), extracted using hipstofits. The EROS-2 fields are shown as solid red lines, the EROS-1fields are shown in cyan for the survey with the T40/CCD camera, and they are shown in yellow for the LMC Schmidt plates. |
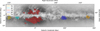 |
Fig. 2 Map of the Galactic plane fields that were regularly observed by EROS-2. The colored contours correspond to the EROS-2 fields and are color-coded for the five regions. The background image shows the density of all Gaia-dr3 sources (Gaia Collaboration 2023), with a square-root scale, as extracted from the CDS using hips2fits. Some artifacts in the form of stripes are visible in the Galactic bulge area. They reflect the effect of the Gaia scanning strategy on its source detection threshold. |
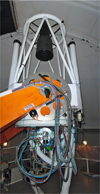 |
Fig. 3 MARLY telescope, equipped with two EROS CCD cameras. |
2.2 The survey
Between July 1996 and February 2003, EROS-2 monitored a number of dense stellar fields within the LMC, the SMC, the Galactic center, and four regions that are also located on the Galactic plane, but lie far from the center. In particular, the regions of the Milky Way were selected based on the least dust extinction.
Table 1 lists the data acquired for these different programs, and Figures 1 and 2 show the maps of the fields that were regularly imaged by EROS-2. Fields that were used to search for supernovae that were not monitored over long periods are not shown. Figure 6 shows the observation epochs covered by EROS-1 and EROS-2 and the other main microlensing surveys.
The main scientific objective of the studies toward the LMC and SMC was the search for massive compact objects in the Galactic halo through microlensing. These programs found only very few microlensing events, and the numbers were compatible with the expectations of self-lensing (due to lenses belonging to the LMC or SMC) plus lenses in the Galactic disk. The results of this program were published and interpreted by Tisserand et al. (2007); Blaineau et al. (2022), who concluded that the contribution to the Galactic halo from massive compact objects with masses between 10−7 and 1000 solar masses is negligible.
Searches toward the Galactic center led to the discovery of hundreds of confirmed microlensing events and to the publication of the optical depth map that traces the column density of matter (Hamadache et al. 2006). Long a specificity of EROS-2, the search in the Galactic spiral arms (GSA), far from the Galactic center, has also enabled us to constrain the contribution of the halo, and above all, to test a thick-disk model. Rahal et al. (2009) provided the optical depths in the four regions based on the detection of 22 microlensing event candidates. A particular difficulty in interpreting these optical depths is that the sources are not at a single distance (as in LMC), but are distributed along the line of sight. Subsequently, Moniez et al. (2017) interpreted the data by using the information from the color-magnitude diagrams of the fields in order to compare all the observables with Galactic models.
Systematic searches for variable stars, both periodic and nonperiodic, were also carried out in each monitored field. The results for searches in the Magellanic Clouds were presented by Tisserand et al. (2009); Kim et al. (2014), those in the Galactic bulge by Tisserand et al. (2008), and those in the spiral arms by Derue et al. (2002).
The microlensing fields were not observable in good conditions all the time. Two other major programs were therefore performed. The first program searched for stars with a high proper motion and set limits on the contribution of cool white dwarfs to the Galactic halo (Goldman et al. 2002).
The second program, comprising about 10% of the observing time, was a semi-automated supernovae search. Fields in low Galactic interstellar absorption areas were observed twice at intervals of 15 to 20 days. An automatic image subtraction and candidate selection was then performed. After a visual scan during the day following the second observation, a final set of potential SN candidates were subjected to complementary observations and/or spectroscopic observations for confirmation. In 1997-1998, about 35 SN were discovered. Spectroscopic observations on the ESO 3.6 m and ARC 3.5 m telescopes showed than 7 of these SNe were of type Ia, one of type Ic, and 2 of type II. A measurement of the SNIa explosion rate at z ~ 0.1 was extracted from these campaigns (Blanc et al. 2004). In the first months of 1999, EROS-2 participated in an international SNIa search campaign led by the Supernova Cosmology Project (SCP). Nine out of the 19 SNIas gathered by this effort were discovered by EROS-2. This nearby SNIa sample was used to improve the cosmological parameter determination (Regnault 2000; Kowalski et al. 2008).
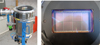 |
Fig. 4 Left: EROS-2 blue camera cryostat. Right: view of the mosaic, showing the 2 × 4 array of 2048 × 2048 CCD sensors. |
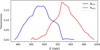 |
Fig. 5 Calculated transmission of the EROS-2 optics (Bauer 1997). |
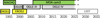 |
Fig. 6 Timeline of the observation epochs for the various surveys dedicated to microlensing. |
3 Data-processing pipeline
The processing of the astronomical images taken by the EROSMARLY telescope and camera represented a major challenge in the 1990s because of the generated data volume and the digital storage and computing power available at that time. The data obtained each night were copied on tape cartridges and shipped from the ESO La Silla observatory to the CNRS/IN2P3 computing center10 in Lyon, where the data were processed and analyzed. The data access and light-curve production was managed by a set of tools, ErosDb, that relied on a relational database. Originally developed in Tcl, ErosDb11 was subsequently rewritten in Java. The image-processing and photometric reconstruction was handled by the PEIDA12 object-oriented C/C++ software, which was designed and developed for the EROS project (Ansari 1996). The EROS images were stored as standard FITS format files, with one file for each of the CCDs, and the light curves were stored in structured compact binary files or the suivi .sv files, with efficient data access.
3.1 PEIDA
The standard processing method used in EROS for the production of light curves relied on the forced photometry paradigm. This assumes that a common set of celestial sources with fixed positions on the sky, but possibly with changing luminosity, is contributing to each image, in addition to a sky background that is nearly uniform over the focal plane. The sky background arises from the light from the Moon, the atmosphere, the instrument, and unresolved sources. This master source list, called the reference catalog, was obtained from the detection of nonextended point-like sources in a deep high-quality image (reference or template image) for each surveyed field. The light curve for each object was then reconstructed by determining the source luminosity or flux in each image, using point spread function (PSF) photometry. A light curve gathers the photometric measurements (flux or magnitude) with the associated date and time of the corresponding image or exposure, as well as ancillary information such as the photometric uncertainty or the sky background level. The main steps of the processing are briefly described below. The images were processed not on a per CCD basis, but rather on the basis of a quarter of the CCD. The imageprocessing pipeline used quarters of CCD image patches that covered ~ 10 × 10 arcmin2 on the sky, with some overlap between quarters for most processing steps. This helped mitigate the effect of parameters that were held constant over the processing patch, such as the PSF parameters, while ensuring acceptable memory requirements for the computing tasks. Each CCD quarter was identified with the parent CCD number (0 to 7) and a letter (k, l, m, and n), as shown in Figures 7 and 8.
The light-curve production was carried out through the following steps: In the CCD bias and gain correction or ISR (Instrument Signature Removal), the raw images obtained from the camera readout were first corrected for a per pixel bias and gain using master bias and gain images for each CCD. The bias images and dome flats were taken each day, before the sky observations, while sky flats were taken from time to time. Individual bias and gain images were processed and filtered to produce the master bias and gain that were used to correct the raw images. This step was performed on the EROS acquisition and processing cluster at La Silla.
We then created a reference image by selecting a set of goodquality exposures, typically 10-15 images, with good seeing and a low level of sky background to create the reference or template image through resampling and co-addition. The astrometric and geometric reference was given by the first image in the stack of co-added images. The EROS reference images were resampled with twice as many pixels (√2 along each axis) as the original image. One image per CCD quarter (k, l, m, and n) covered more than one quarter of the CCD, about ~1200 × 1200 pixels, to help us to manage the shift between images during co-addition. To prevent the same celestial object from appearing in different subfields, however, each object catalog in this public release covers exactly one quarter of the CCD, corresponding to an area with ~1450 × 1450 pixels in the reference image, or 1024 × 1024 in a standard image13. The number of photometric measurements drops for objects near the quarter edges because of the shift in position between images that is up to several hundred pixels.
Several star finders were available in the PEIDA package. The reference catalog (StarList) was created from the reference image by applying the matched filter star finder. This detector used a filtered image obtained by convolving the reference image with a Gaussian shape expected for a star or point source. The sources were then selected after applying a threshold on the filtered image, followed by steps to drop multiple detections of a single source and to separate neighboring, blended sources. The two starlists obtained from the red and blue reference images, were then cross-matched and merged, and each list was supplemented with sources that were too faint to be selected in the first color, but bright enough to be detected in the second color. We did not directly use the luminosity or flux obtained from the reference image as the flux of the object in the reference catalog because the resampling process did not ensure photon or flux conservation. The reference flux was instead obtained by computing the average flux from all the individual images used in the co-addition.
Each individual image quarter, called current image, was first analyzed to compute the geometrical projection of the reference catalog on it, and to determine its PSF parameters. A star detector with a high threshold was used to obtain a list of rather bright sources in the image, followed by their position and flux determination. This list was then cross-matched with the bright sources of the reference catalog, and we determined the parameters of the geometric projection of the reference catalog on the corresponding quarter of the image. The PSF parameters in the image were then determined through a PSF fitting of a sample of bright isolated stars. PEIDA included several analytical forms for the PSF, but none was able to faithfully describe the EROS image PSFs for all seeing conditions. A two-dimensional Gaussian-shaped PSF defined by the three parameters σx, σy, andρ was used for the standard EROS light-curve production, and the finite size of pixels was taken into account in the fit. With this Gaussian PSF, the photons from a normalized source (unit flux) centered at (x0, y0) are spread out according to
![Mathematical equation: \begin{aligned} \phi(x,y) = \frac{\sqrt{1 - \rho^2}}{2 \pi \sigma_x \sigma_y} \, \exp \left[ - \frac{1}{2} \left( u^2 + v^2 - 2 \rho \, u v \right) \right] . \\ u = \frac{x - x_0}{\sigma_x} \hspace{4mm} ; \hspace{4mm} v = \frac{y - y_0}{\sigma_y}. \end{aligned}](/articles/aa/full_html/2026/02/aa57321-25/aa57321-25-eq2.png) (2)
(2)
The distributions of the seeing parameters σx and σy for the ∼2500 exposures of the field lm055 are shown in Fig. 9. The effective seeing is clearly worse for the peripheral CCDs. The mean of σ over all exposures and CCDs is near zero, but its value depends on the hour angle and on the CCD, giving an overall r.m.s. spread of ∼0.15.
The geometric projection parameters of the reference catalog in the current image, as well as as the corresponding PSF parameters determined previously were then used for the forced photometry step to compute the brightness or flux for each source in the current image and add a new point to the light curve. For each star in the reference catalog, a patch with typically 200–400 pixels around its projected position on the current image was extracted. The flux of the source was then fit, taking contributions from all the neighboring sources and a sky background level into account that was constant over the patch. We fixed the positions of all the sources corresponding to the reference catalog positions, projected on the current image, and the PSF parameters, while fitting all the contributing source fluxes. In addition to the fitted luminosity in each color, the fit procedure provided additional quantities, such as the flux uncertainty, and the fit quality or χ2/dof (chi2r, chi2b), which are included in the public data. The original EROS light-curve data, stored in suivi files, contain additional information, such as the fitted sky background, alternative flux determinations, and aperture photometry, for instance, or an independent estimate of the source position in the current image, which were used infrequently in the EROS analysis and were not included in the released dataset.
Although the PSF photometry corrects to some extent for the observed luminosity variations caused by some of the observing conditions, namely the seeing and sky background variations, the fluxes obtained from the forced photometry step in individual images are affected by atmospheric absorption and subtle camera response variations that are not corrected for by the ISR. The relative flux alignment was the last step of the standard photometric reconstruction in EROS and corresponded to determining an overall absorption that affected the source luminosities. A global flux change with respect to the reference flux, modeled usually as a linear function, was determined assuming that the luminosity of the main fraction of sources was constant over time. The values of fluxes that were included in the light curves that are made public (fluxr and fluxb) and corresponding errors (efluxr and efluxb) were obtained after correcting for a possible differential absorption with respect to the reference flux.
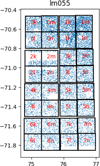 |
Fig. 7 Map of the lm055 field showing the positions of stars with Beros < 18. and the boundaries of the CCD quarters used in the star catalogs. The empty circles correspond to masked regions centered on bright foreground stars that saturated the CCD. The empty rectangles in CCDs 2 and 7 are dead regions of the red CCD. |
 |
Fig. 8 Zoom of CCD 3 showing the boundaries of the reference images and the orientation of the x- and y-axes. |
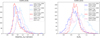 |
Fig. 9 Distributions of the PSF parameters σx and σy defined by Equation (2) for field lm055. The parameters are shown for the central CCDs (2, 3, 4, and 5) and peripheral CCDs (0, 1, 6, and 7) and for the two bandpasses Beros (dark and light blue) and Reros (red and pink). |
3.2 Post-processing
Before the light-curve analysis was started, we removed measurements taken under far from normal conditions from the light curves. This occurred frequently because the data-taking policy was to observe whenever possible and left the task of rejecting these abnormal measurements to the analysis. They were identified by extreme values of the sky background, seeing, or absorption. The precise cuts on these quantities depended on the field, but generally, images with a seeing greater than 4 arcsec were eliminated, as were images with an absorption relative to the reference image greater than 5. Measurements near the full Moon were generally eliminated. In addition, images in which the photometry failed for over 40% of the cataloged stars were eliminated, as were images for which more than 12% of the stars varied by more than three standard deviations from their average flux. Depending on the CCD, the number of rejected images varied between 7 and 18%, with an average of 11%14.
To reduce systematic errors in the photometry, each light curve was searched for significant linear correlations between the measured flux and three observational variables: the seeing, the hour angle, and the airmass. This was done independently in the two passbands. The measured fluxes were corrected linearly by requiring a vanishing correlation coefficient between the corrected fluxes and the given variable. The strongest correlation was found with the seeing in both passbands.
Examples of light curves are shown in Figs. 10, 11 and 12. Figures 10 and 11 show a LMC microlensing event and an LMC Cepheid variable star, respectively, seen by EROS-2 and OGLE. Figure 12 shows an LMC microlensing event discovered by OGLE (Mróz et al. 2024a) in a star that is not cataloged by EROS-2. The event was subsequently recovered through differential photometry in EROS-2 images with the software tool Triton (Le Guillou 2003).
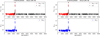 |
Fig. 10 OGLE microlensing candidate OGLE-LMC-06 as seen by EROS-2 (object lm0570n29305) and OGLE. The left panels shows EROS (Tisserand et al. 2007) and OGLE (Mróz et al. 2024a) magnitudes measured as a function of (ehjd = mjd - 49999.5), spanning nearly 25 years in total and 7 years for EROS. The closeup view over 200 days around the microlensing event is shown on the right. The top plots show the measurements in the Reros and Iogle bands, and Beros is shown in the bottom panels. Measurements obtained through difference-image photometry (dph) using the Triton package (Le Guillou 2003) were also added in the right panels for ehjd >2350 and confirm a secondary peak around ehjd ~ 2400. The dph points (magenta) were shifted by one day for clarity. The second luminosity peak occurred near the full Moon, and many points in the standard light curve are therefore missing. |
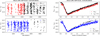 |
Fig. 11 Light curve of a Cepheid variable star with a period of ~3.4 days, as seen by EROS-2and OGLE. The left plots show the magnitude measurements as a function of time in days (mjd - 49999.5) over more than ten years, and the right plots show the magnitude measurements folded over a single period. The top plots show the measurements in the Reros and Iogle bands, and Beros and Vogle are shown in the bottom panels. OGLE data for this Cepheid were obtained from https://ogledb.astrouw.edu.pl/~ogle/OCVS/. |
4 Photometric and astrometric precision
Two examples of LMC color-magnitude diagrams (CMDs) are shown in Figure 13. They are both characterized by a clearly defined bump of clump giants. The main sequence is seen in the CMD for lm055, a field with a typical stellar density. It is far weaker in the dense field lm001, where the magnitude limit is lower because bright stars have a high density.
The observed stellar population magnitude distribution for the same two LMC CCD-quarters and the associated photometric errors are shown in Figure 14. The bump caused by clump giants is clearly visible in the lm055 magnitude distribution histograms at Reros ~ 18.5 and Beros ~ 19.
The photometric precision of individual measurements is nominally given by the PEIDA fitter. For lm055, the photometric precision σmag is better than 0.1 (10%) for stars brighter than Beros ≲ 19.5 in blue and Reros ≲ 19 in red. In very crowded fields, such as lm001, the same precision is reached for stars that are brighter by half a magnitude.
The star sky coordinates of EROS-2 stars were derived near the end of the survey data-taking period using the astrometric resources available at the time. The comparison with modern Gaia astrometry (Gaia Collaboration 2016, 2023) reveals offsets of about 0.1-0.3 arcsec that vary from one field to the next. Figure 15 shows histograms of the separation of bright stars (Beros < 19) in the EROS catalog from the nearest Gaia object for central and peripheral CCDs. The blue histogram is found using the original EROS-2 astrometry, while the red histogram is found after adjusting the EROS-2 (RA, Dec) grid to the Gaia grid, using a quadratic fit for each CCD-quarter. The corrected sky coordinates using Gaia astrometry are included in the source catalogs ( .xcat files ) that are released (see Section A.2 below). These corrected EROS-2 sky coordinates improve the mean EROS-Gaia separation from ~0.3 arcsec to ~0.13 arcsec.
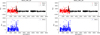 |
Fig. 12 OGLE microlensing candidate OGLE-LMC-04 in OGLE (Mróz et al. 2024a) and EROS. The star is not in the EROS-2 catalog, so that the EROS measurements have been obtained through difference-image photometry using the Triton package (Le Guillou 2003) on EROS-2images. Measurements span about 25 years, ~8 years of which were for EROS. The right panel shows a closeup view over 600 days at about the microlensing event. |
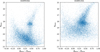 |
Fig. 13 Color-magnitude diagram for two CCD quarters (CCD 3, quarter m), illustrating the observed stellar population and its variation in the LMC area. lm055 (left) is a typical field, and lm001 (right) is a dense field in the LMC bar. |
5 The dataset
The EROS data that are made public through the CDS are organized as a set of four types of interconnected tables. The precise definition of the quantities in the tables is given in Appendix A, and examples are shown in Fig. A.1. The four table types are listed below.
List of all object catalogs, catlist.xcatinfo. For each object catalog, the list gives the corresponding CCD quarter, the number of objects, the limits of the sky region, the number of objects with a photometric resolution better than 10% and the corresponding magnitudes, and the magnitude limits encompass 90% of the objects. The mean offsets for the CCD quarter between the original EROS astrometry and Gaia Data-Release 3 astrometry are also listed (Gaia Collaboration 2023). A detailed description of the fields in this general catalog can be found in Appendix A.1.
The object catalogs, one for each CCD quarter with .xcat extension. They gather the information extracted from the reference catalog for each object or source, uniquely associated with a string identifier (erosid) that is made from the EROS field, the CCD, and its quarter, concatenated with an integer sequence number. For each entry, the table contains the source position on the sky and in the reference image and its luminosity as obtained by the photometric reconstruction from images stacked to compute the reference image. Each table entry (a source) is enriched with quantities computed from the corresponding light curve: the average and median magnitude, and associated fluctuations. This dataset is organized as one file for each CCD quarter and for each field, with .xcat extension, and the file content is described in Appendix A.1.
Light curves correspond to the sequence of photometric measurements and the associated date or time for each object or source in the object catalog. Each light curve is stored as a single file with .xtime extension and the source erosid as the file name. The content of the light-curve files is described in Appendix A.3.
The image catalogs, with one file per EROS field with .xtinfo extension, contains the basic information for each of the exposures taken in that field. There is one entry for each image corresponding to one CCD in a camera, and the image itself is stored as a FITS file. In addition to the file name and exposure date or time encoded as the Modified Julian Day, this table contains synthetic information about the image quality provided by the photometric reconstruction, such as the Gaussian PSF parameters. Despite the processing by CCD quarter, which yields the image parameters for each quarter, the xtinfo files provide only per CCD quality parameters. Although the images are not directly stored at the CDS, they are accessible through links from the EROS database at the CC-IN2P3. The content of the image catalog files is described in Appendix A.4.
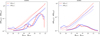 |
Fig. 14 Magnitude distributions and photometric resolution for field lm055 (left, a field of typical density) and field lm001 (right, a very dense field). The histograms show the distribution of Beros in blue and Reros in red on a linear vertical scale, and the lines correspond to the r.m.s. magnitude resolutions as a function of Reros and Beros in logarithmic scale. The dashed blue and red lines represent the photometric uncertainties for Beros and Reros, as estimated by the PEIDA fitter, and the adjacent dotted blue and red lines were derived from the light-curve dispersion of the data points. |
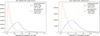 |
Fig. 15 EROS-Gaia separations for the original EROS astrometry and for the Gaia (Gaia Collaboration 2023) astrometry. |
6 Conclusions
We have presented the database of the EROS-2 program available through the CDS portal. We hope that the light curves and images will be useful for understanding transient objects observed in present and future programs.
Data availability
The dataset described in this paper is available at the CDS via https://cdsarc.cds.unistra.fr/viz-bin/cat/II/390. Detailed information on the electronically available tables is provided in the Appendix A.
Acknowledgements
In addition to the authors, the production and analysis of the EROS-2 data relied on the work of our deceased colleagues: Pierre Bareyre, Florian Bauer, Sergio Char, Jean Guibert, Jacques Haissinski, Eric Maurice, Alain Milsztajn, Luciano Moscoso, and Cécile Renault. We are appreciative of their contribution and dedicate this publication to their memory. We thank Jean-Baptiste Marquette for his work on the astrometry and Jean-Paul Le Fèvre for help with the production of the catalogs. This work has made use of data from the European Space Agency (ESA) mission Gaia (https://www.cosmos.esa.int/gaia), processed by the Gaia Data Processing and Analysis Consortium (DPAC, https://www.cosmos.esa.int/web/gaia/dpac/consortium). Funding for the DPAC has been provided by national institutions, in particular the institutions participating in the Gaia Multilateral Agreement. This research made use of hips2fits15, a service provided by CDS.
References
- Alcock, C., Akerlof, C. W., Allsman, R. A., et al. 1993, Nature, 365, 621 [NASA ADS] [CrossRef] [Google Scholar]
- Alcock, C., Allsman, R. A., Alves, D. R., et al. 2000, ApJ, 542, 281 [NASA ADS] [CrossRef] [Google Scholar]
- Ansari, R. 1996, Vistas Astron., 40, 519 [NASA ADS] [CrossRef] [Google Scholar]
- Ansari, R., Cavalier, F., Moniez, M., et al. 1996, A&A, 314, 94 [Google Scholar]
- Arnaud, M., Aubourg, E., Bareyre, P., et al. 1994a, Exp. Astron., 4, 265 [Google Scholar]
- Arnaud, M., Aubourg, E., Bareyre, P., et al. 1994b, Exp. Astron., 4, 279 [Google Scholar]
- Aubourg, E., Bareyre, P., Bréhin, S., et al. 1993a, Nature, 365, 623 [NASA ADS] [CrossRef] [Google Scholar]
- Aubourg, E., Bareyre, P., Brehin, S., et al. 1993b, The Messenger, 72, 20 [NASA ADS] [Google Scholar]
- Bauer, F. 1997, PhD thesis, Université Paris 7, France [Google Scholar]
- Bauer, F., & de Kat, J. 1997, Nucl. Instrum. Methods Phys. Res. A, 387, 286 [Google Scholar]
- Bauer, F., & de Kat, J. 1998, in Astrophysics and Space Science Library, 228, Optical Detectors for Astronomy, eds. J. Beletic, & P. Amico, 191 [Google Scholar]
- Berger, J., Cordoni, J. P., Fringant, A. M., et al. 1991, A&AS, 87, 389 [Google Scholar]
- Blaineau, T., Moniez, M., Afonso, C., et al. 2022, A&A, 664, A106 [NASA ADS] [CrossRef] [EDP Sciences] [Google Scholar]
- Blanc, G., Afonso, C., Alard, C., et al. 2004, A&A, 423, 881 [NASA ADS] [CrossRef] [EDP Sciences] [Google Scholar]
- Bond, I. A., Udalski, A., Jaroszynski, M., et al. 2004, ApJ, 606, L155 [NASA ADS] [CrossRef] [Google Scholar]
- Derue, F., Afonso, C., Alard, C., et al. 2001, A&A, 373, 126 [NASA ADS] [CrossRef] [EDP Sciences] [Google Scholar]
- Derue, F., Marquette, J. B., Lupone, S., et al. 2002, A&A, 389, 149 [NASA ADS] [CrossRef] [EDP Sciences] [Google Scholar]
- Gaia Collaboration (Prusti, T., et al.) 2016, A&A, 595, A1 [NASA ADS] [CrossRef] [EDP Sciences] [Google Scholar]
- Gaia Collaboration (Vallenari, A., et al.) 2023, A&A, 674, A1 [NASA ADS] [CrossRef] [EDP Sciences] [Google Scholar]
- Goldman, B., Afonso, C., Alard, C., et al. 2002, A&A, 389, L69 [NASA ADS] [CrossRef] [EDP Sciences] [Google Scholar]
- Hamadache, C., Le Guillou, L., Tisserand, P., et al. 2006, A&A, 454, 185 [NASA ADS] [CrossRef] [EDP Sciences] [Google Scholar]
- Janesick, J., & Elliott, T. 1992, in Astronomical Society of the Pacific Conference Series, 23, Astronomical CCD Observing and Reduction Techniques, ed. S. B. Howell, 1 [Google Scholar]
- Kim, D.-W., Protopapas, P., Bailer-Jones, C. A. L., et al. 2014, A&A, 566, A43 [CrossRef] [EDP Sciences] [Google Scholar]
- Kowalski, M., Rubin, D., Aldering, G., et al. 2008, ApJ, 686, 749 [NASA ADS] [CrossRef] [Google Scholar]
- Le Guillou, L. 2003, PhD thesis, Université Paris 6, thèse de doctorat dirigée par Éric Aubourg, Constituants Elémentaires Systèmes Complexes, Paris 6, 2003 [Google Scholar]
- Mansoux, B. 1997, PhD thesis, Universite Paris 7, 1997PA077330 [Google Scholar]
- Möller, A., Peloton, J., Ishida, E. E. O., et al. 2021, MNRAS, 501, 3272 [CrossRef] [Google Scholar]
- Moniez, M., Sajadian, S., Karami, M., Rahvar, S., & Ansari, R. 2017, A&A, 604, A124 [NASA ADS] [CrossRef] [EDP Sciences] [Google Scholar]
- Mróz, P., Udalski, A., Szymanski, M. K., et al. 2024a, ApJS, 273, 4 [Google Scholar]
- Mróz, P., Udalski, A., Szymanski, M. K., et al. 2024b, ApJ, 976, L19 [Google Scholar]
- Mróz, P., Udalski, A., Szymanski, M. K., et al. 2024c, Nature, 632, 749 [CrossRef] [Google Scholar]
- Mróz, P., Udalski, A., Szymanski, M. K., et al. 2025, ApJS, 280, 49 [Google Scholar]
- Paczynski, B. 1986, ApJ, 304, 1 [NASA ADS] [CrossRef] [Google Scholar]
- Rahal, Y. R., Afonso, C., Albert, J. N., et al. 2009, A&A, 500, 1027 [NASA ADS] [CrossRef] [EDP Sciences] [Google Scholar]
- Rahvar, S. 2015, Int. J. Mod. Phys. D, 24, 1530020 [NASA ADS] [CrossRef] [Google Scholar]
- Regnault, N. 2000, PhD thesis, Universite Paris 7, 2000PA077198 [Google Scholar]
- Renault, C., Afonso, C., Aubourg, E., et al. 1997, A&A, 324, L69 [NASA ADS] [Google Scholar]
- Renault, C., Aubourg, E., Bareyre, P., et al. 1998, A&A, 329, 522 [NASA ADS] [Google Scholar]
- Schneider, P., Kochanek, C., & Wambsganss, J. 2006, Gravitational Lensing: Strong, Weak and Micro (Springer) [Google Scholar]
- Sumi, T., Abe, F., Bond, I. A., et al. 2003, ApJ, 591, 204 [NASA ADS] [CrossRef] [Google Scholar]
- Tisserand, P. 2004, Theses, Université Nice Sophia Antipolis, France [Google Scholar]
- Tisserand, P., Le Guillou, L., Afonso, C., et al. 2007, A&A, 469, 387 [NASA ADS] [CrossRef] [EDP Sciences] [Google Scholar]
- Tisserand, P., Marquette, J. B., Wood, P. R., et al. 2008, A&A, 481, 673 [NASA ADS] [CrossRef] [EDP Sciences] [Google Scholar]
- Tisserand, P., Wood, P. R., Marquette, J. B., et al. 2009, A&A, 501, 985 [NASA ADS] [CrossRef] [EDP Sciences] [Google Scholar]
- Udalski, A., Szymanski, M., Kaluzny, J., et al. 1993, Acta Astron., 43, 289 [NASA ADS] [Google Scholar]
- Udalski, A., Szymanski, M., Kubiak, M., et al. 2000, Acta Astron., 50, 307 [NASA ADS] [Google Scholar]
- Wyrzykowski, L., Skowron, J., Kozlowski, S., et al. 2011, MNRAS, 416, 2949 [NASA ADS] [CrossRef] [Google Scholar]
- Zaritsky, D., Harris, J., Thompson, I. B., & Grebel, E. K. 2004, AJ, 128, 1606 [Google Scholar]
EROS http://eros.in2p3.fr
MAssive Compact Halo Object (MACHO) project https://wwwmacho.anu.edu.au
Optical Gravitational Lensing Experiment (OGLE) https://ogle.astrouw.edu.pl
CDS, Strasbourg astronomical Data Center: https://cds.unistra.fr
LSST is the survey program that will begin at the end of 2025 by the Vera C. Rubin Observatory: https://rubinobservatory.org
Fink: The transient alert broker system associated with LSST - https://fink-broker.org/about/
MARLY telescope at ESO: https://www.eso.org/public/teles-instr/lasilla/marly/
The Loral corporation was a defense contractor founded in 1948 and acquired by Lockheed-Martin in 1996. Check https://en.wikipedia.org/wiki/Loral_Corporation for the Loral corporation history and https://www.inknowvation.com/sbir/story/our-history-fairchild-imaging for the CCD manufacturing activities. An overview of the history of the development and use of large CCD array sensors in astronomy at the time of EROS-2 camera design can be found in Janesick & Elliott (1992).
The Digital Equipment Corporation was a US computer manufacturer company founded in 1957, active till the end of 1990's, before being taken over by Compaq. Check https://en.wikipedia.org/wiki/Digital_Equipment_Corporation or https://www.computerhistory.org/brochures/d-f/digital-equipmentcorporation-dec/ for more information about the company history and products.
CC-IN2P3 : https://cc.in2p3.fr/
ErosDb: EROS data and processing management software tools - https://erosdb.in2p3.fr
PEIDA: Photométrie et Etude d’Images Destiné à l’Astrophyique - http://eros.in2p3.fr/peida
The division of each CCD into quarters that is used for the public catalogs differs slightly from the division that is used for the published EROS-2 papers, so that the designation of objects in the publications may differ from those in the public catalogs.
The largest single cause for rejection was the malfunction that affected five CCDs of the Reros passband camera starting in January 2002. We therefore chose to reject all measurements taken in 2002 and 2003 for these five CCDs.
CDS VizieR web portal: https://vizier.cds.unistra.fr
VizieR Queries (astroquery.vizier) python package: https://astroquery.readthedocs.io/en/latest/vizier/vizier.html
Modified Julian Day: MJD = JD - 2400000.5
MAMA was developed and operated by INSU/CNRS.
Appendix A Detailed description of EROS-2 table columns
In this appendix we describe the elements of the publicly-available files, examples of which are shown in Fig. A.1. All the files described here are plain text files, with one header line starting with the hash character, with the name of the fields in each line of the file. The values on each line, as well as the field of column names in the first line are separated by spaces.
These files have been transferred to CDS and ingested as VizieR tables, and accessible through the EROS dataset URL: https://cdsarc.cds.unistra.fr/viz-bin/cat/II/390. It can be queried interactively through the VizieR web portal16 and subset of the EROS data can be selected and downloaded using python packages such as PyVO17 or VizieR Queries18.
The catalog and light curve files described here are archived at CC-IN2P3 and can be accessed through web links (URL) which will be displayed on the EROS collection pages at CDS.
A.1 List of EROS-2 catalogs (xcatinfo)
This single file named catlist.xcatinfo presents a top level view of the whole dataset, One with one line containing the following information for each xcat file.
field_ccd_quarter (string) : The field identification, followed by the CCD number (0-7) and quarter (k,l,m,n). For example sm0023m refers to the SMC field 002, CCD 3 and quarter m.
Nstars (integer) : Number of stars in the corresponding object catalog (xcat file).
minRA, maxRA, minDec, maxDec (float) Limit in rightascension and declination covered by the corresponding object catalog.
nstR10, nstB10 (integer) : Number of stars with better than 10% photometric precision in Reros and Beros bands.
magR10, magB10 (float) : Upper magnitude limits for stars with photometric precision better 10% in Reros and Beros.
maglimitR, maglimitB (float) : Upper magnitudes limits encompassing 90% of stars in Reros and Beros.
diffRA_gaia, diffDec_gaia (float) : Mean offset of original EROS-2 astrometry compared to Gaia astrometry (Gaia Collaboration 2023) in right-ascension and declination.
Nexp (integer) Number of exposures or measurements for the corresponding xcat file.
epoch (string) The observation date of the first image used to create the red band reference image, formatted as yyyy/mm/dd. This defines the epoch of the celestial source positions on the image plane that have been used to determine the astrometric projection.
Values of most of the above quantities, aggregated over all fields for each target, is given in table 1
A.2 EROS-2 Object catalog (xcat)
This part of the EROS dataset gathers object catalog files, with one file for each CCD-quarter with one line per object. There are a total of 2783 files for the EROS LMC fields (lm), 316 for SMC fields (sm), 2532 files for the Galactic Bulge (cg) fields and 913 for spiral arm fields (gs/bs/gn/tm). The Object catalog gathers the information for each source or star for which a light curve is provided, organized as up to 32 files for each EROS-2 field, one for each CCD quarter. The file names are made of the field identifier, followed by the CCD number and the quarter identifier letter, with the file extension .xcat. The file lm0554m.xcat for example contains the list of sources for the LMC field 055, CCD # 4, quarter m. The two letters lm, sm, cg, bs, gs, gn, tm are the prefixes used for the LMC, SMC, Galactic Bulge, βSct, γSct, γNor and θMus respectively.
erosid (string) : unique EROS object identifier, composed of the field name, CCD number and quarter and a integer, a sequence number identifying the source in the corresponding sub-field. For example, lm0554m4824 is the erosid for the source with the sequence number 4824, in quarter m of CCD 4, in the field lm055.
RA, Dec (float) : The source position on the sky, the right ascension and the declination (α, δ) in decimal degrees and J2000 epoch according to the original EROS-2 astrometry.
MagR, MagB (float): Source apparent magnitude in the EROS red (Reros) and blue (Beros) passbands. These values are computed from measurements decorrelated from observing conditions (Sect. 3.2) along the light curve, so they cannot be obtained directly from fluxRefR, fluxRefB values described below.
errMagR, errMagB (float): uncertainty of the source magnitudes for the two passbands (Reros, Beros)
XR, YR, XB, YB (float): The source position along the first (X) and second (Y) CCD axis on the red (R) and blue (B) reference images, in pixel units.
fluxRefR, fluxRefB (float): source luminosity or flux, in ADU units, on the red Reros and blue Beros EROS passbands in the reference catalog. These fluxes correspond to the average of fluxes determined by the forced photometry on the set of images stacked to obtain the reference image.
Nmeas (integer) : number of measurements on the light curve (no unit)
medianMagR, medianMagB (float): median magnitudes computed from the light curve in the EROS red and blue passbands.
sigpullMagR, sigpullMagB (float): standard deviation of magnitudes with respect to the median in the two passbands
corrRA, corrDec (float) : Corrected source position on the sky, using Gaia astrometry (Gaia Collaboration 2023). The right ascension and the declination (α,δ) are expressed in decimal degrees and J2000 epoch.
A.3 EROS-2 Light curves (xtime)
Each light curve, composed of the sequence of the photometric measurements and the corresponding date and time for a given celestial source is stored in a file having the EROS source identifier (erosid) as its name, with the extension .xtime. There is one xtime file for each star in the xcat. Each xtime begins with a four-line header followed by one line per exposure. The header contains the erosid, (MagR,MagB), errMagR, errMagB and (XR,YR,XB,YB from the corresponding xcat line.
The following information is provided for each point along the light curve. Note that a nan (not a number) is written when the data is missing.
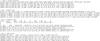 |
Fig. A.1 The top lines of examples of the tables described in Appendix A. From top to bottom: the list of xcat files, catlist.xcatinfo; the object catalog (xcat) file for the CCD-quarter lm0553k; the light-curve (xtime) file for the object lm0553k21; and the image list (tinfo) file for the field lm055. |
date (float): EROS heliocentric Julian date (~mjd -49999.5), identical to the ehjd field of the image catalog (.xtinfo).
MagR, MagB (float): Estimated magnitudes in the two EROS passbands (Reros, Beros) for this point along the light curve.
ErMagR, ErMagB (float): Estimated magnitude uncertainties in the two passbands.
fluxr, fluxb (float) : source luminosity in the two passbands, in ADU units, as computed by the photometric pipeline on the two associated images, corrected by the relative photometric alignment procedure.
efluxr, efluxb (float): luminosity or estimated flux uncertainties, in ADU’s, as computed by the photometric reconstruction.
chi2r, chi2b (float): Reduced chi-square (χ2/ndof) of the PEIDA photometric PSF fit in the two passbands - can be used to drop unreliable flux estimates.
datecode (string): The encoded exposure date (year,month,day), followed by an exposure sequence number used in the image names. The date, encoded with 4 characters, correspond to the day before the night observations (same date in UTC or local time). The first character (0..9a..z) represent the year, starting with 0 for 1990. 6 corresponds thus to 1996, a to 2000, c to 2002. The second character (a..l) represents the month, and two characters, the day as two digits.
redimage (string): The name of the image in the Reros band.
blueimage (string): The name of the image in the Beros band.
Note that for each point along the light curve, the source luminosities fluxr, fluxb as estimated by the photometric pipeline have been slightly corrected, using a linear function to cancel the observed average biases correlated with image seeing, the hour angle (target observation angle with respect to the meridian) and the airmass, as described in Tisserand (2004), chapter 6, paragraph 6.3. The seeing is the parameter having the largest effect on the photometric biases. The corrected luminosities have then been converted into magnitudes, using zero point magnitudes derived from the absolute photometric calibration.
A.4 EROS-2 Image catalog (xtinfo)
This catalog provides basic characteristics of EROS images used to obtain the light curves. It is organized as one file per field, with the corresponding field identifier as the file name with the .xtinfo extension. The file lm055.xtinfo contains for example the list of all images for LMC field lm055 with one entry per CCD. The table has the following columns described below.
filename (string) : image file name which is obtained from a concatenation of the EROS field, the camera and CCD numbers, the image type (reduced image in this case), the encoded exposure date (year,month,day) (the day before the night observations) and an exposure sequence number for that observation night. Note that these are the offset subtracted and gain corrected images. Refer to the datecode field in .xtime files in paragraph A.3 for the description of date and sequence number encoding in the image names.
mjd (float): exposure date and time represented as the modified Julian date MJD19 (unit=days).
ehjd (float): EROS heliocentric Julian date, in days unit, identical to the time stored in light curve files. It is obtained from the mjd, correcting for the light propagation time if the telescope was moved to the center of the solar system, with an offset=49999.5, as if the origin was shifted to early October 1995.
fond (float) : sky background corresponding to typical pixel brightness level, for image area outside sources, in ADU unit.
psf_sig_x, psf_sig_y, psf_rho (float): Gaussian PSF parameters, in pixel units (1 pixel ~eq0.6 )
absorp (float) : the absorption relative to reference image. This parameter is obtained from the distribution of the ratio
 of typical stars flux after relative photometric alignment (fluxCal) divided by the one before (fluxUnCal).
airmass (float): ~1/ cos(za) with za the zenith angle.
tsid (string) : Local sidereal time, formatted as hh-mm-ss.s - date (string) : the exposure date, formatted as year-month-day. Note that this is the string representation of the date encoded in the image name, which corresponds to the day before the night observations.
Appendix B EROS-2 images
The reference co-added images, projected to CDS-Aladin grid are available at CDS and can be viewed using the Aladin viewer. The reference images, as well as individual images are archived at the CC-IN2P3 an can be accessed through links displayed by the CDS VizieR when browsing through the image catalog. The reference images correspond to resampled, stacked image, with a pixel size (~ 0.4 ) smaller that the EROS camera CCD pixels, with each image covering more than a quarter of a CCD, with 1800 × 1800 pixels, corresponding to a ~1270 × 1270 pixels area on the CCD. Standard images, referred also to as current images in this article, covers the full CCD with 2048 × 2048 pixels.
Appendix C EROS-1-CCD Data
The data from EROS-1-CCD survey of Magellanic clouds, carried out with the T40 (Arnaud et al. 1994a) setup from 1991 to 1995 is also being made public. The 40 cm reflecting telescope was equipped with a mosaic of 16 buttable CCD’s, each with 400 × 579 pixels, covering a total area of 1° × 0.4° on sky. A single field in the LMC bar (Fig. 1) was observed with high cadence, during three observing seasons, 1991-92, 1992-93 and 1993-94. A single field in SMC was observed in the 199495 season. Images were successively taken through two filters, defining the EROS-1 red (R) and blue (B) bands. The interest of this dataset is mainly related to the high sampling rate of the light curves, less than half an hour in each band. The analysis for each observing season was carried out independently. Light curves were obtained with an early version of the photometric reconstruction pipeline described in section 3.
C.1 EROS-1-CCD Images
For each observing season, reference co-added images as well as individual images for each CCD are being made available, one co-added image for each CCD and each of the two filters (R,B), and around 1000 images for each CCD and each filter. Note that there are missing CCD’s in each season. The reference images were made independently for each CCD, with an oversampling factor 2.5. A narrow band around the image was cut out, to ensure a uniform exposure, despite small shifts between individual images, resulting in images of approximately ~900 × 1400 pixels, covering slightly less than a single CCD, with the exact reference image size depending on the observing season.
An image catalog, similar to the one described in section A.4, organized as one table for each season provides characteristics of the standard images. A separate file provides the list of the reference image for the observing season.
filename (string) : image file name which is obtained from a concatenation of several parts, starting with xe for LMC and se for SMC, followed by three characters, CCD number (00 01 ...15), and the filter (b,r). The last 6 characters of the name correspond to the encoded exposure date (the day before the night observations) as (year,month,day, 4 characters) and an exposure sequence number in hexadecimal for that observation night. The file xe04r2b211e.fits correspond to an LMC image, CCD 04, with the red filter, taken on 21 February 1992, and a sequence number 1e.
NumCCD (integer): CCD number , 0 . . . 15
Filter (character): filter (B / R)
RA, Dec (float) : image center position
DateTimeTU (string) : observation date and time, formatted as yyyy-mm-ddThh:mm:ss.s for example 1991-12-19T10:07:11.0
TStart (integer) : observation time in seconds, since January 1st, 1990, at 00h.
Fond (float) : sky background corresponding to typical pixel brightness level, for image area outside sources, in ADU unit.
psf_sig_x, psf_sig_y, psf_rho (float): Gaussian PSF parameters, in pixel units (1 pixel ~eq0.6 )
absorp (float) : the absorption relative to reference image, computed from the distribution of the ratio of typical star fluxes, after and before relative photometric alignment.
airmass (float): ~1/ cos(za) with za the zenith angle.
C.2 EROS-1-CCD star catalog and light curves
A catalog for a subset of sources for which the light curves are available is provided for each of the four observing seasons. As for EROS-2, photometric calibration was performed using the Magellanic Clouds Photometric Survey (Zaritsky et al. 2004). EROS-1-CCD magnitudes in the two filters can be converted to standard magnitudes through the relations:

with zero point magnitudes  .
.
The list of objects for which light curve are available can be found the object catalog file, with one file for each CCD and each observing season. The file LMC9293_14.xcat for example gathers the list of stars for the 1992-93 observing season and CCD 14. The object catalog contains the following fields:
erosid (string) : unique EROS object identifier, composed of one character identifying the target, x for LMC, s for SMC, CCD number 00, 01 ...15 and quarter and a sequence number identifying the source in the corresponding CCD.
RA, Dec (float) : The source position on the sky, the right ascension and the declination (α, δ) in decimal degrees and J2000 epoch.
MagR, MagB (float): Source apparent magnitude in the EROS-1 red and blue passbands.
XR, YR, XB, YB (float): The source position along the first (X) and second (Y) CCD axis on the red (R) and blue (B) reference images, in pixel units. Note that the images publicly accessible have had their first axis inverted (see above, paragraph C.1)
fluxRefR, fluxRefB (float): source luminosity or flux, in ADU units, on the red and blue EROS-1 passbands in the reference catalog.
NmeasR, NmeasB (integer) : number of measurements in the red and blue light curves (no unit)
medianFluxR, medianFluxB (float) : median flux in the two passbands, along the light curve.
sigpullFluxR, sigpullFluxB (float) : dispersion of the flux values in the two passbands, with respect to the median along the light curve.
For each source in the object catalog, there is one light curve file, gathering the photometric measurements as a function of time in the two passbands. Each light curve contains the following fields:
TStart (integer) : observation time in days, since January 1st, 1990, at 00h.
Filter (character): filter (B / R)
flux (float) : source luminosity in ADU units, as computed by the photometric pipeline on the two associated images, corrected by the relative photometric alignment procedure.
errflux (float): luminosity or estimated flux uncertainties, in ADU’s, as provided by the photometric reconstruction.
Appendix D EROS-1-Schmidt-Plates light curves
The EROS-1-Schmidt-Plates program used observations during three annual periods (October-March), the first plate taken October 16, 1990 and the last March 27, 1993. A total of 290 usable photographic 29 × 29 cm2 plates were obtained at the E.S.O Schmidt telescope (1 meter free aperture, f/3). Half of the plates (098-04 emulsion) were taken with a RG630 red filter and half (IIaO emulsion) with a GG385 blue filter. Exposure times were 1 hour in each color, and apart from the very crowded LMC bar region, our star detection efficiency abruptly drops at a limiting magnitude of around 20.5 in red and 21.5 in blue. The data taking period is limited by the maximum excursion of the telescope around the meridian position (±2.5 hours). The time sampling of the plates makes the experiment sensitive to microlensing event durations ranging from a few days to a few months.
The usable field shown in Fig 1 covered with a plate is 5.2° × 5.2°, centered on position (α = 5h20′,δ = −68°30′) (eq. 2000). The transmission coefficient, T, of each plate was digitized to 0.8 giga-pixels of 10 microns size (0.675 arcsec), with 12 bits dynamic range, using the “MAMA”20 microdensitometer (Machine Automatique à Mesurer pour l’Astronomie) at the Observatoire de Paris ((Berger et al. 1991). The digitization took 6 hours per plate, yielding 28 × 28 = 784 images, covering each ~1 cm2 with 1024 × 1024 pixels. The Schmidt plates are being digitized again at the Observatoire de Paris and the resulting digital images will be made available through CDS.
Photometry was performed using the quantity ΦT = [(1 -T)/T]0.6 which varies approximately linearly with the flux Φ collected on the photographic plate in the magnitude range [17,21] (blue) [16,20] (red). We therefore use ΦT in our photometric fitting and star finding procedures. The thus obtained star magnitudes were originally corrected using an empirical formula derived from comparison of selected fields with CCD measurements taken with the E.S.O-Danish 1.54m telescope. Subsequent comparison with the Zaritsky catalog (Zaritsky et al. 2004) has confirmed the calibration to a precision of 0.2mag outside the LMC bar. Stars in the densest regions of the LMC bar may have listed magnitudes incorrect by as much as 1 mag.
For analysis purposes, the LMC field was divided into 784 sub-fields covering 1 cm2 of the Schmidt plate. These sub-fields are referred to as pavés. The list of objects for which light curve are available can be found the object catalog file, with one file for each pavé. The file pave660.xcat for example gathers the list of stars for the pavé 660.
The object catalog contains the following fields: - erosid (string) : object identifier within the given pavé.
RA, Dec (float) : The source position on the sky, the right ascension and the declination (α, δ) in decimal degrees and J2000 epoch.
NmeasR, NmeasB (integer) : number of measurements in the red and blue light curves (no unit)
MagR, MagB (float): Mean source apparent magnitude in the EROS-1 (Schmidt) red and blue passbands.
errMagR, erMagB (float): Mean source apparent magnitude error in the EROS-1 (Schmidt) red and blue passbands.
sigpullMagR, sigpullMagB (float) : dispersion of the flux values in the two passbands, with respect to the median along the light curve.
For each source in the object catalog, there is one light curve file, gathering the photometric measurements as a function of time in the two passbands. Each light curve contains the following fields:
TStart (integer) : observation time in days, since January 1st, 1990, at 00h.
Filter (character): filter (B / R)
Mag (float) : source luminosity in ADU units, as computed by the photometric pipeline on the two associated images, corrected by the relative photometric alignment procedure.
errMag (float): luminosity or estimated flux uncertainties, in ADU’s, as provided by the photometric reconstruction.
Fond (float): Sky background under the star.
Poll (float): "pollution" from neighboring stars.
All Tables
All Figures
|
Fig. 1 EROS LMC (left) and SMC (right) fields superimposed on images of the full Gaia-dr3 catalog numbers counts (Gaia Collaboration 2023), extracted using hipstofits. The EROS-2 fields are shown as solid red lines, the EROS-1fields are shown in cyan for the survey with the T40/CCD camera, and they are shown in yellow for the LMC Schmidt plates. |
| In the text | |
|
Fig. 2 Map of the Galactic plane fields that were regularly observed by EROS-2. The colored contours correspond to the EROS-2 fields and are color-coded for the five regions. The background image shows the density of all Gaia-dr3 sources (Gaia Collaboration 2023), with a square-root scale, as extracted from the CDS using hips2fits. Some artifacts in the form of stripes are visible in the Galactic bulge area. They reflect the effect of the Gaia scanning strategy on its source detection threshold. |
| In the text | |
|
Fig. 3 MARLY telescope, equipped with two EROS CCD cameras. |
| In the text | |
|
Fig. 4 Left: EROS-2 blue camera cryostat. Right: view of the mosaic, showing the 2 × 4 array of 2048 × 2048 CCD sensors. |
| In the text | |
|
Fig. 5 Calculated transmission of the EROS-2 optics (Bauer 1997). |
| In the text | |
|
Fig. 6 Timeline of the observation epochs for the various surveys dedicated to microlensing. |
| In the text | |
|
Fig. 7 Map of the lm055 field showing the positions of stars with Beros < 18. and the boundaries of the CCD quarters used in the star catalogs. The empty circles correspond to masked regions centered on bright foreground stars that saturated the CCD. The empty rectangles in CCDs 2 and 7 are dead regions of the red CCD. |
| In the text | |
|
Fig. 8 Zoom of CCD 3 showing the boundaries of the reference images and the orientation of the x- and y-axes. |
| In the text | |
|
Fig. 9 Distributions of the PSF parameters σx and σy defined by Equation (2) for field lm055. The parameters are shown for the central CCDs (2, 3, 4, and 5) and peripheral CCDs (0, 1, 6, and 7) and for the two bandpasses Beros (dark and light blue) and Reros (red and pink). |
| In the text | |
|
Fig. 10 OGLE microlensing candidate OGLE-LMC-06 as seen by EROS-2 (object lm0570n29305) and OGLE. The left panels shows EROS (Tisserand et al. 2007) and OGLE (Mróz et al. 2024a) magnitudes measured as a function of (ehjd = mjd - 49999.5), spanning nearly 25 years in total and 7 years for EROS. The closeup view over 200 days around the microlensing event is shown on the right. The top plots show the measurements in the Reros and Iogle bands, and Beros is shown in the bottom panels. Measurements obtained through difference-image photometry (dph) using the Triton package (Le Guillou 2003) were also added in the right panels for ehjd >2350 and confirm a secondary peak around ehjd ~ 2400. The dph points (magenta) were shifted by one day for clarity. The second luminosity peak occurred near the full Moon, and many points in the standard light curve are therefore missing. |
| In the text | |
|
Fig. 11 Light curve of a Cepheid variable star with a period of ~3.4 days, as seen by EROS-2and OGLE. The left plots show the magnitude measurements as a function of time in days (mjd - 49999.5) over more than ten years, and the right plots show the magnitude measurements folded over a single period. The top plots show the measurements in the Reros and Iogle bands, and Beros and Vogle are shown in the bottom panels. OGLE data for this Cepheid were obtained from https://ogledb.astrouw.edu.pl/~ogle/OCVS/. |
| In the text | |
|
Fig. 12 OGLE microlensing candidate OGLE-LMC-04 in OGLE (Mróz et al. 2024a) and EROS. The star is not in the EROS-2 catalog, so that the EROS measurements have been obtained through difference-image photometry using the Triton package (Le Guillou 2003) on EROS-2images. Measurements span about 25 years, ~8 years of which were for EROS. The right panel shows a closeup view over 600 days at about the microlensing event. |
| In the text | |
|
Fig. 13 Color-magnitude diagram for two CCD quarters (CCD 3, quarter m), illustrating the observed stellar population and its variation in the LMC area. lm055 (left) is a typical field, and lm001 (right) is a dense field in the LMC bar. |
| In the text | |
|
Fig. 14 Magnitude distributions and photometric resolution for field lm055 (left, a field of typical density) and field lm001 (right, a very dense field). The histograms show the distribution of Beros in blue and Reros in red on a linear vertical scale, and the lines correspond to the r.m.s. magnitude resolutions as a function of Reros and Beros in logarithmic scale. The dashed blue and red lines represent the photometric uncertainties for Beros and Reros, as estimated by the PEIDA fitter, and the adjacent dotted blue and red lines were derived from the light-curve dispersion of the data points. |
| In the text | |
|
Fig. 15 EROS-Gaia separations for the original EROS astrometry and for the Gaia (Gaia Collaboration 2023) astrometry. |
| In the text | |
|
Fig. A.1 The top lines of examples of the tables described in Appendix A. From top to bottom: the list of xcat files, catlist.xcatinfo; the object catalog (xcat) file for the CCD-quarter lm0553k; the light-curve (xtime) file for the object lm0553k21; and the image list (tinfo) file for the field lm055. |
| In the text | |
Current usage metrics show cumulative count of Article Views (full-text article views including HTML views, PDF and ePub downloads, according to the available data) and Abstracts Views on Vision4Press platform.
Data correspond to usage on the plateform after 2015. The current usage metrics is available 48-96 hours after online publication and is updated daily on week days.
Initial download of the metrics may take a while.