Fig. 14
Download original image
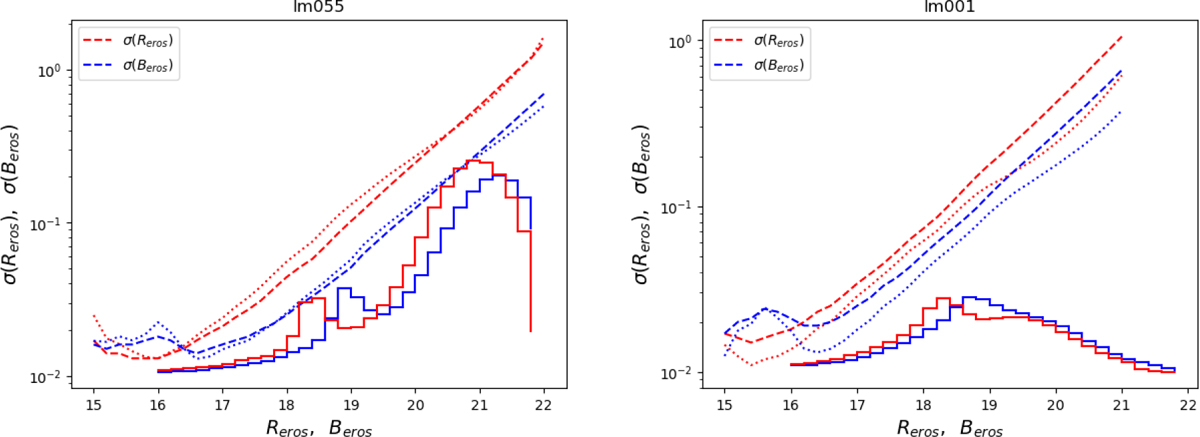
Magnitude distributions and photometric resolution for field lm055 (left, a field of typical density) and field lm001 (right, a very dense field). The histograms show the distribution of Beros in blue and Reros in red on a linear vertical scale, and the lines correspond to the r.m.s. magnitude resolutions as a function of Reros and Beros in logarithmic scale. The dashed blue and red lines represent the photometric uncertainties for Beros and Reros, as estimated by the PEIDA fitter, and the adjacent dotted blue and red lines were derived from the light-curve dispersion of the data points.
Current usage metrics show cumulative count of Article Views (full-text article views including HTML views, PDF and ePub downloads, according to the available data) and Abstracts Views on Vision4Press platform.
Data correspond to usage on the plateform after 2015. The current usage metrics is available 48-96 hours after online publication and is updated daily on week days.
Initial download of the metrics may take a while.