Fig. 2
Download original image
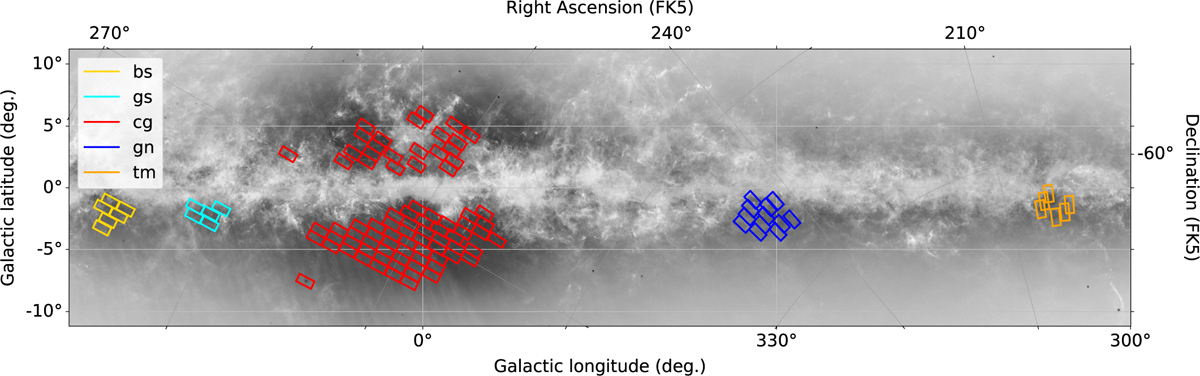
Map of the Galactic plane fields that were regularly observed by EROS-2. The colored contours correspond to the EROS-2 fields and are color-coded for the five regions. The background image shows the density of all Gaia-dr3 sources (Gaia Collaboration 2023), with a square-root scale, as extracted from the CDS using hips2fits. Some artifacts in the form of stripes are visible in the Galactic bulge area. They reflect the effect of the Gaia scanning strategy on its source detection threshold.
Current usage metrics show cumulative count of Article Views (full-text article views including HTML views, PDF and ePub downloads, according to the available data) and Abstracts Views on Vision4Press platform.
Data correspond to usage on the plateform after 2015. The current usage metrics is available 48-96 hours after online publication and is updated daily on week days.
Initial download of the metrics may take a while.