Fig. 7
Download original image
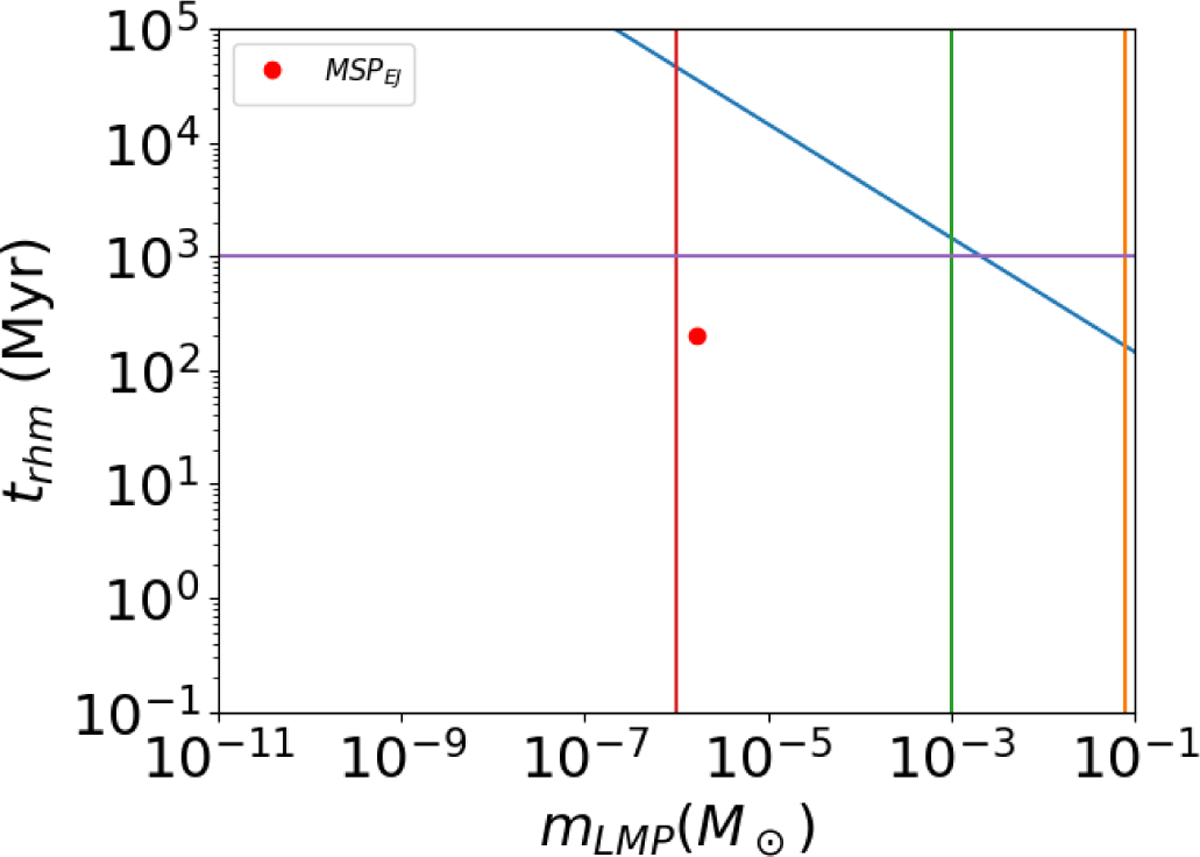
Relaxation timescale of LMP population for different masses using our initial conditions for the number of LMP and the half-mass radius. The relaxation timescale for an Earth mass and a Jupiter mass are from the red line and green line, respectively. The orange line shows the star limit (i.e., the ignition of hydrogen at ≈ 0.08 M⊙). The red dot shows the timescale considering a mass spectra of LMP in a uniform logarithmic distribution, ranging from Earth mass to Jupiter mass, using the same initial condition of our main models. Finally, the blue line shows results taking into account the initial conditions of the model C05.
Current usage metrics show cumulative count of Article Views (full-text article views including HTML views, PDF and ePub downloads, according to the available data) and Abstracts Views on Vision4Press platform.
Data correspond to usage on the plateform after 2015. The current usage metrics is available 48-96 hours after online publication and is updated daily on week days.
Initial download of the metrics may take a while.