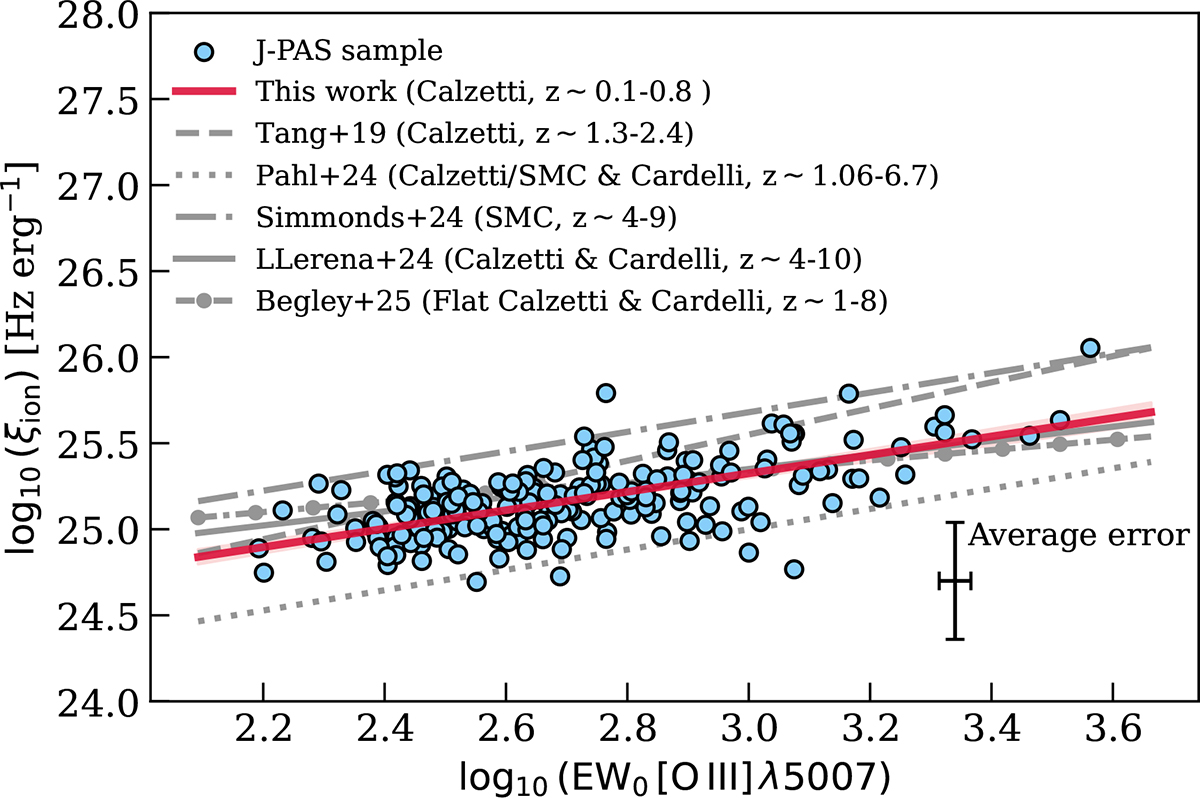
Fig. 10.
Download original image
Relation between the ionizing photon production efficiency, log(ξion), and the rest-frame EW of [O III], log(EW0 [O III]). The blue points represent our sample of EELGs, with a typical error bar shown in the lower right region. The solid red line indicates the best-fit linear relation obtained in this work using a Markov chain Monte Carlo approach, with the shaded area showing the 1σ confidence interval. For comparison, previous relations from the literature are also shown: Tang et al. (2019), dashed), Pahl et al. (2025), dotted), Simmonds et al. (2024), dash-dotted), Llerena et al. (2024b), solid), and Begley et al. (2025), solid with dot.)
Current usage metrics show cumulative count of Article Views (full-text article views including HTML views, PDF and ePub downloads, according to the available data) and Abstracts Views on Vision4Press platform.
Data correspond to usage on the plateform after 2015. The current usage metrics is available 48-96 hours after online publication and is updated daily on week days.
Initial download of the metrics may take a while.