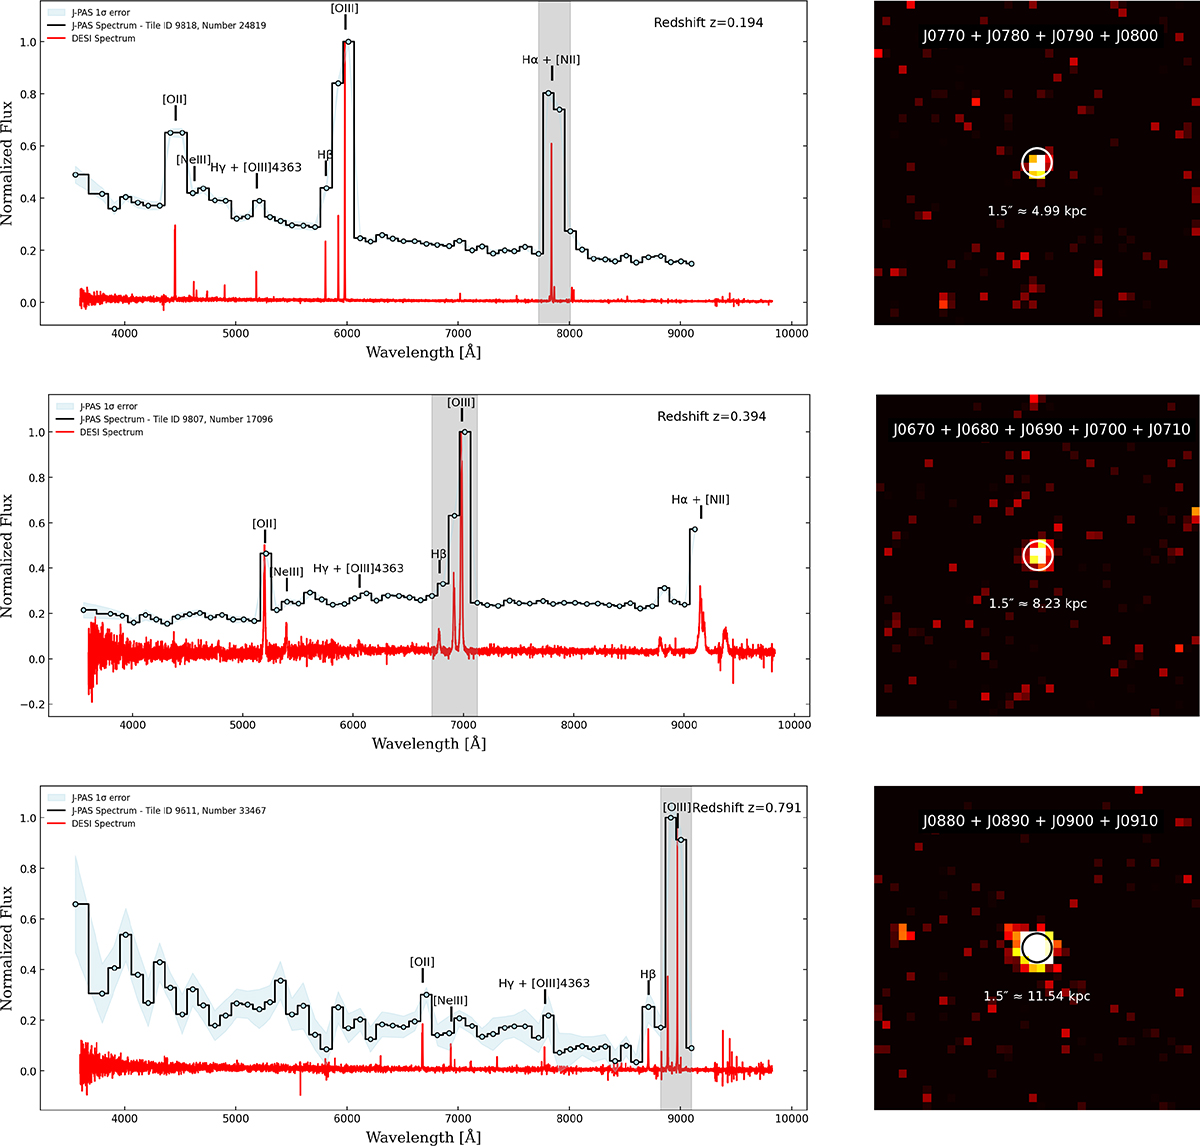
Fig. 2.
Download original image
Data products from J-PAS for the EELG candidates. Left: J-PAS photometric spectrum (black line) and the corresponding DESI spectrum (red line). The shaded grey region marks the wavelength range selected for integration. Right: Image cutouts resulting from integrating the data cube over the selected spectral region. The horizontal white bar is 2 arcseconds in length. With J-PAS we are able to detect the continuum, but not with DESI.
Current usage metrics show cumulative count of Article Views (full-text article views including HTML views, PDF and ePub downloads, according to the available data) and Abstracts Views on Vision4Press platform.
Data correspond to usage on the plateform after 2015. The current usage metrics is available 48-96 hours after online publication and is updated daily on week days.
Initial download of the metrics may take a while.