Fig. 5.
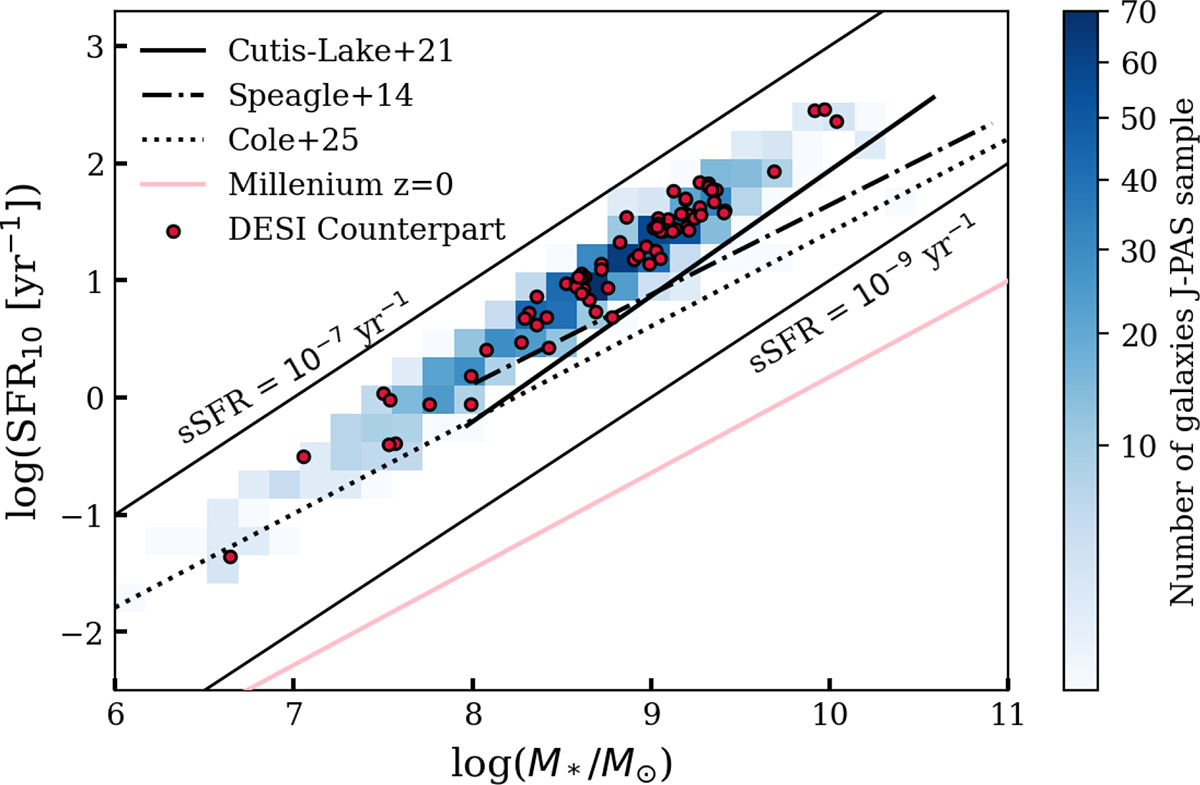
Download original image
MS of star-forming galaxies. The plot shows the logarithm of the SFR, log(SFR10), versus the logarithm of the stellar mass, log(M★). The SFR10 refers to the average SFR over the past 10 Myr. Red points indicate galaxies with spectroscopic observations from DESI. The dotted black line shows the relation from Cole et al. (2025) at redshift 4.5–5. The solid black line corresponds to the relation from Curtis-Lake et al. 2021 (mock photometric samples of galaxies at z ≈ 5), the dot-dashed line the relation from Speagle et al. (2014), 64 measurements of the star-forming ‘MS’ from literature out to z ≈ 6), and the pink line the results from the Millennium Simulation (Springel et al. 2005). The dashed lines draw regions of constant sSFRs at values of −7 and −9.
Current usage metrics show cumulative count of Article Views (full-text article views including HTML views, PDF and ePub downloads, according to the available data) and Abstracts Views on Vision4Press platform.
Data correspond to usage on the plateform after 2015. The current usage metrics is available 48-96 hours after online publication and is updated daily on week days.
Initial download of the metrics may take a while.