Open Access
Fig. 9.
Download original image
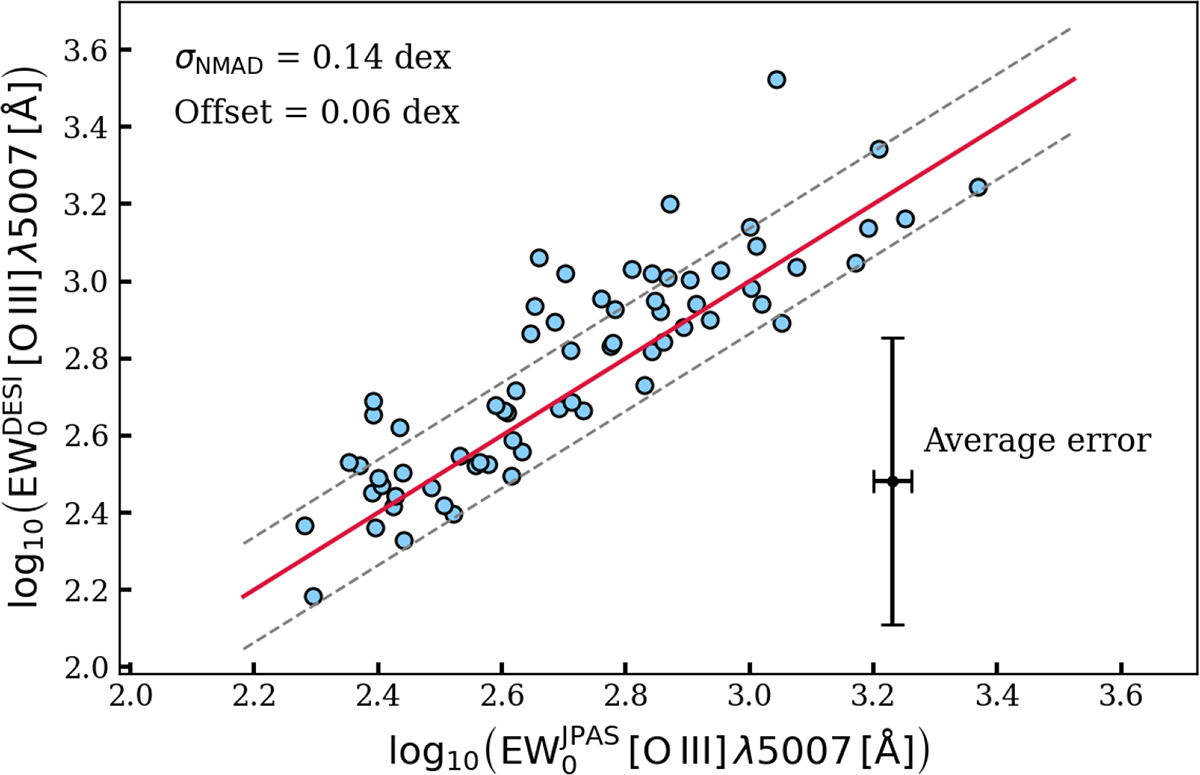
J-PAS EW compared with the spectroscopic EW from the DESI counterpart for [O III] λ5007 Å line emission. White triangles are upper limits. Grey lines indicate the limits of the ±1σ region.
Current usage metrics show cumulative count of Article Views (full-text article views including HTML views, PDF and ePub downloads, according to the available data) and Abstracts Views on Vision4Press platform.
Data correspond to usage on the plateform after 2015. The current usage metrics is available 48-96 hours after online publication and is updated daily on week days.
Initial download of the metrics may take a while.