Fig. 2.
Download original image
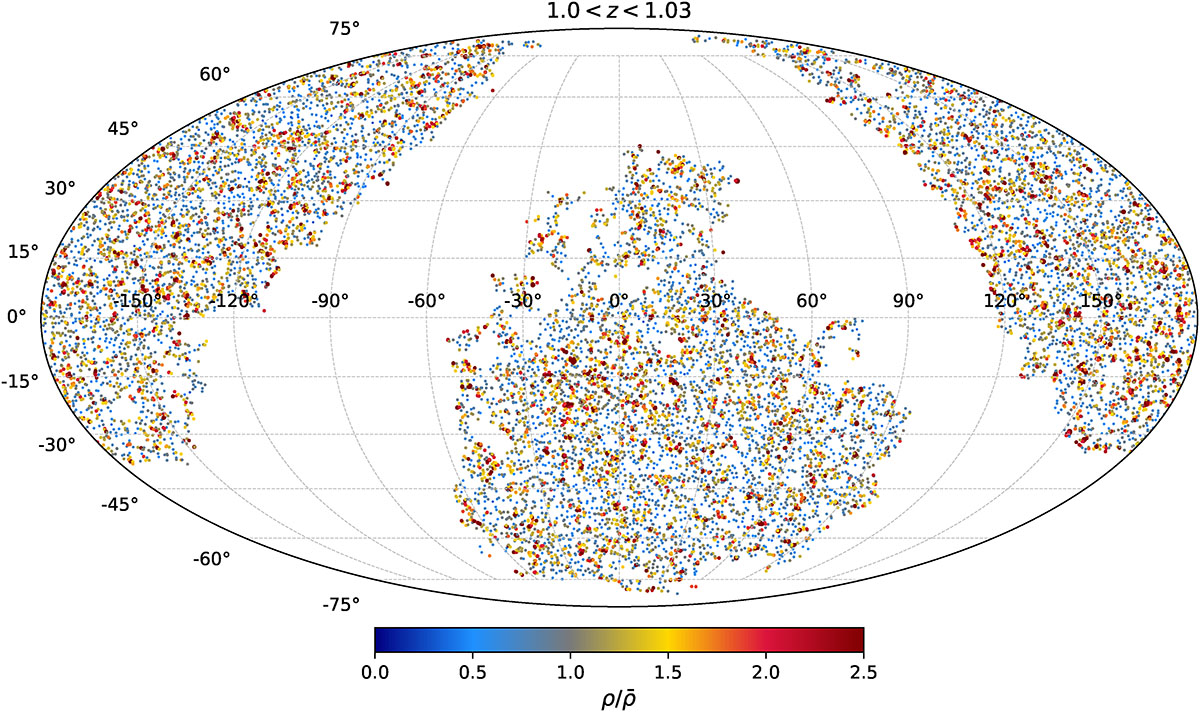
Redshift slice of the Quaia catalogue at 1.0 < z < 1.03 in equatorial coordinates. Based on the Voronoi tessellation, the reconstructed local over-density (![]() ) at the quasar positions is colour-coded and the size of the points is also proportional to their density. Pixels of low completeness are excluded from the analysis using the angular selection function. The map shows large-scale clustering of quasars, without clearly outstanding features.
) at the quasar positions is colour-coded and the size of the points is also proportional to their density. Pixels of low completeness are excluded from the analysis using the angular selection function. The map shows large-scale clustering of quasars, without clearly outstanding features.
Current usage metrics show cumulative count of Article Views (full-text article views including HTML views, PDF and ePub downloads, according to the available data) and Abstracts Views on Vision4Press platform.
Data correspond to usage on the plateform after 2015. The current usage metrics is available 48-96 hours after online publication and is updated daily on week days.
Initial download of the metrics may take a while.