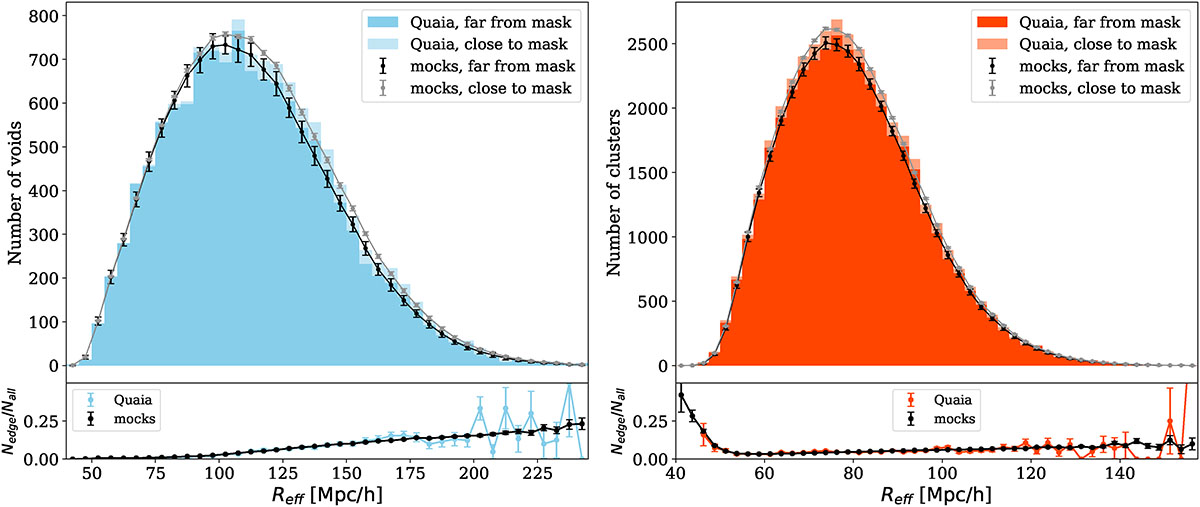
Fig. 4.
Download original image
Void radii (left) and cluster radii distribution (right) in the Quaia catalogue. With full colours, we show structures that are far from the mask (EdgeFlag = 0), while pale bars on top show the number of voids and clusters close to the survey edge (EdgeFlag = 1). We found good agreement when comparing the observations with the mean and standard deviation of the mocks (black and grey data points). On the main panels, error bars correspond to the standard deviations of the 50 mock realizations. In the bottom panels, error bars for the mocks are again estimated from the 50 realisations, while for Quaia we used the binomial sample standard deviation ![]() with p = Nedge/Nall where N is the number of voids in the bin. We also used these error estimations in Figs. 5–8.
with p = Nedge/Nall where N is the number of voids in the bin. We also used these error estimations in Figs. 5–8.
Current usage metrics show cumulative count of Article Views (full-text article views including HTML views, PDF and ePub downloads, according to the available data) and Abstracts Views on Vision4Press platform.
Data correspond to usage on the plateform after 2015. The current usage metrics is available 48-96 hours after online publication and is updated daily on week days.
Initial download of the metrics may take a while.