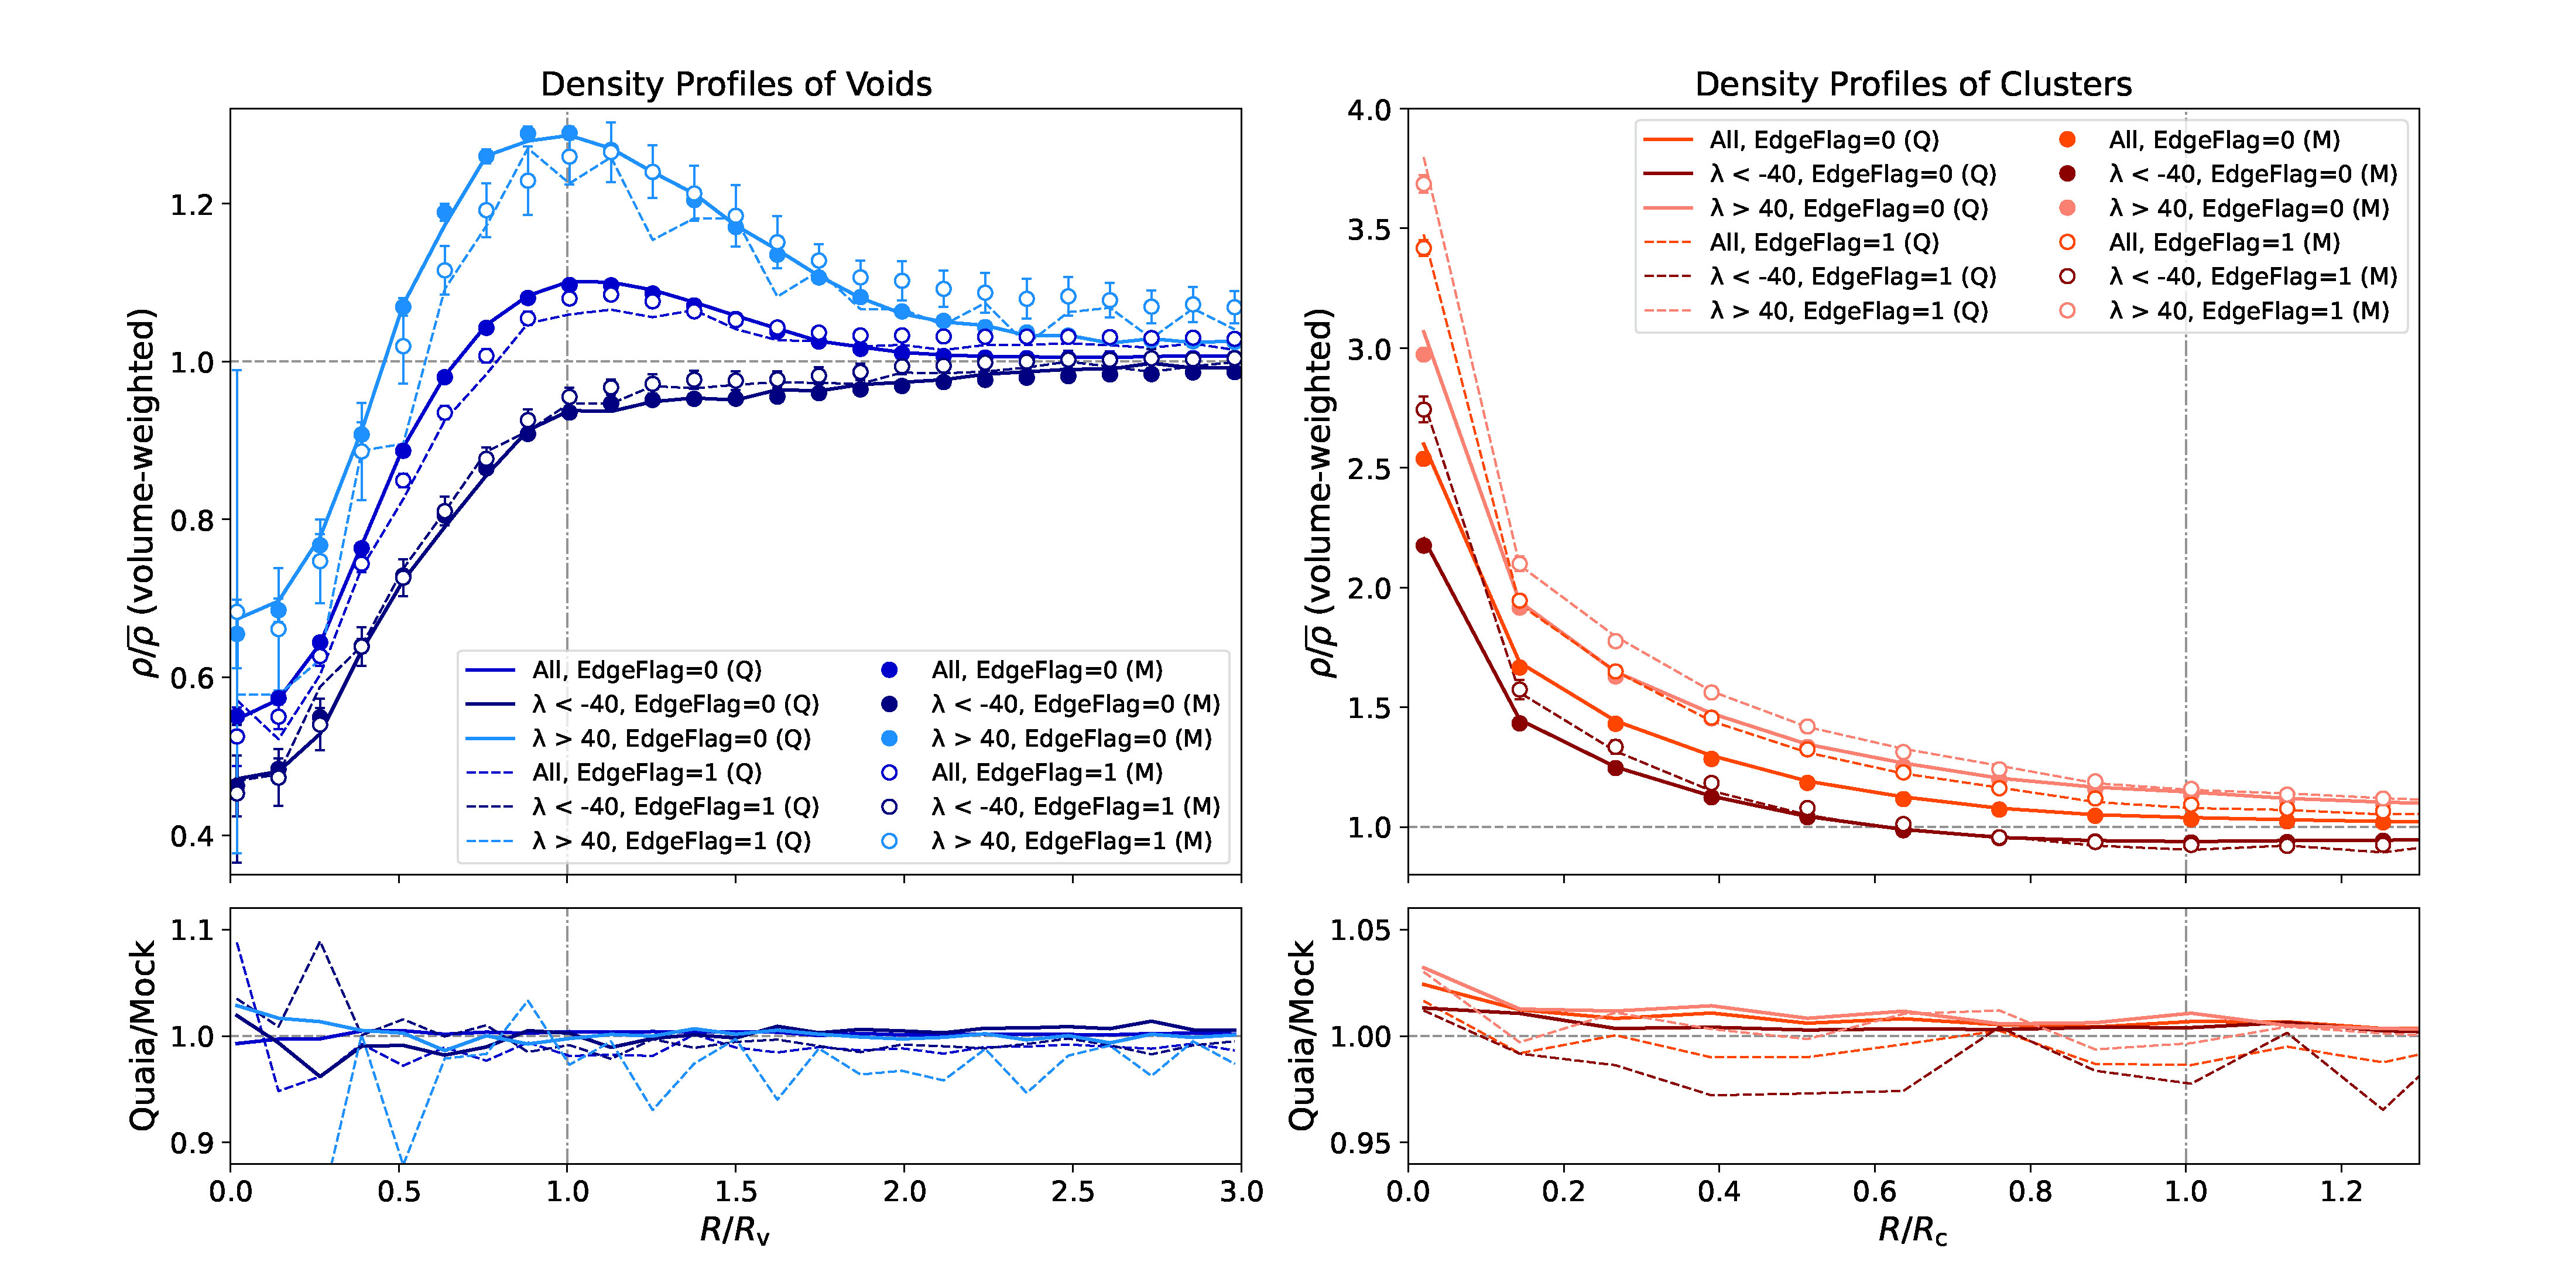
Fig. 9.
Download original image
Density profiles of voids (left) and clusters (right) in the Quaia catalogue. We again compare structures near and far from the survey edges, and also assess consistency between data (Q) and mocks (M) in the bottom panels. We show the density profiles using all voids and clusters, and we also split the catalogues into subsets with extreme values of λv and λc, as a proxy for their environment.
Current usage metrics show cumulative count of Article Views (full-text article views including HTML views, PDF and ePub downloads, according to the available data) and Abstracts Views on Vision4Press platform.
Data correspond to usage on the plateform after 2015. The current usage metrics is available 48-96 hours after online publication and is updated daily on week days.
Initial download of the metrics may take a while.