Fig. 6.
Download original image
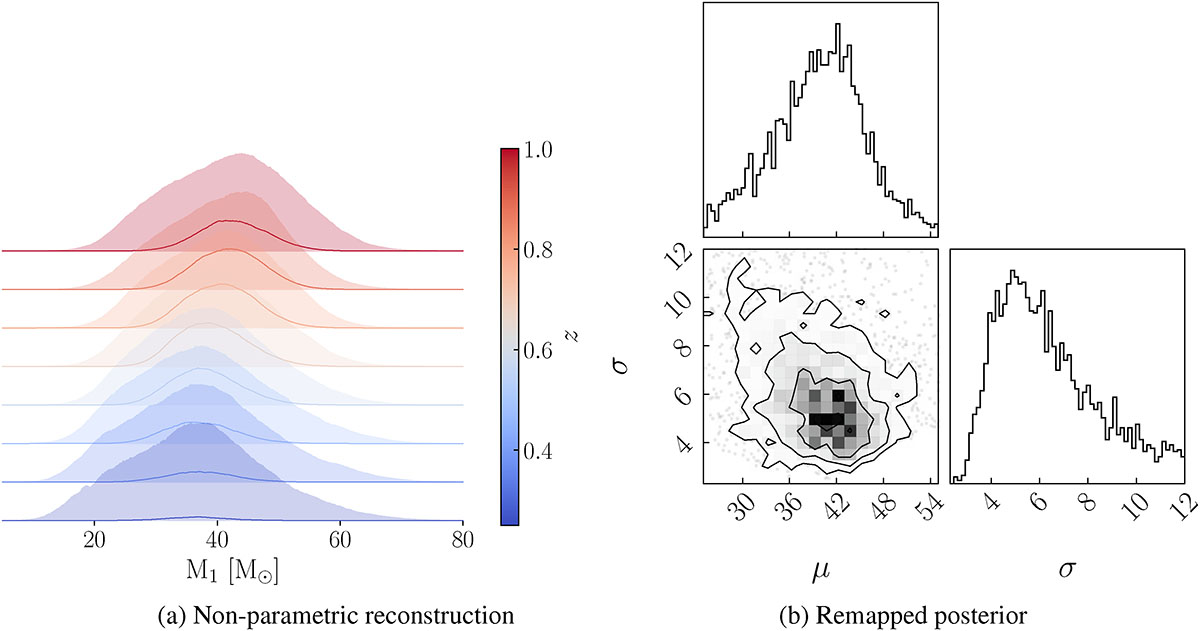
Left: M1 − z non-parametric reconstruction using GWTC-3 events. For each redshift value, the mass distribution has been normalised, and the shaded areas mark the 68% credible regions. Right: Posterior distribution for μ and σ of a Gaussian distribution obtained from the non-parametric reconstruction using the remapping procedure presented in Rinaldi et al. (2025b).
Current usage metrics show cumulative count of Article Views (full-text article views including HTML views, PDF and ePub downloads, according to the available data) and Abstracts Views on Vision4Press platform.
Data correspond to usage on the plateform after 2015. The current usage metrics is available 48-96 hours after online publication and is updated daily on week days.
Initial download of the metrics may take a while.