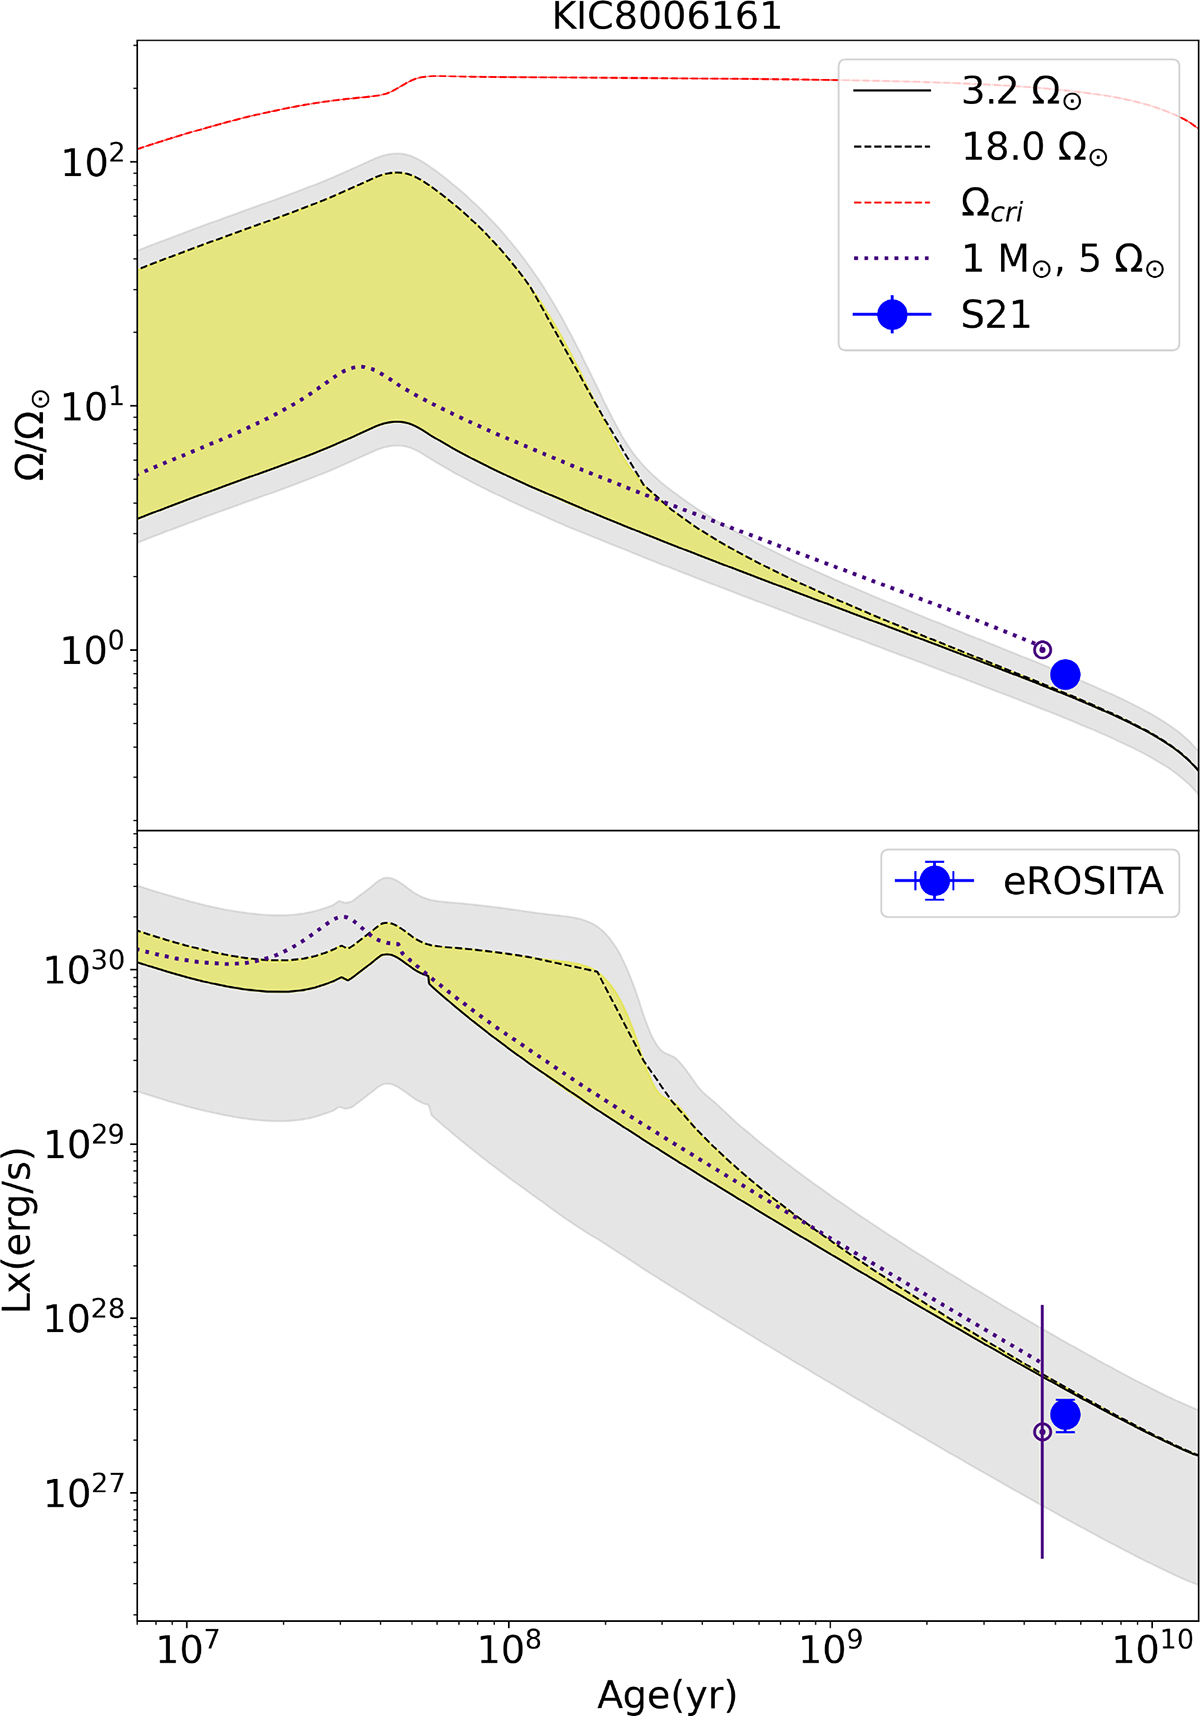
Fig. 5.
Download original image
Evolution of the surface rotation rate (top) and X-ray luminosity (bottom) of KIC 8006161. The yellow shaded areas indicate the region explored by the tracks across the evolution of the star, for 3.2 ≤ Ωin/Ω⊙ ≤ 18. The gray shaded areas show 20% (top) and global one order of magnitude (bottom) further variation at the limit of the yellow areas, to account for deviations from more likely rotational histories and fluctuation in the X-ray luminosity due to cyclic or stochastic magnetic activity. The red-dashed line in the top panel shows the evolution of the critical rotation rate, defined as the limit at which the centrifugal acceleration at the equator equals gravity. The blue markers show observational data. For comparison, evolutionary tracks for a 1 M⊙ star are showed, with observational data from Table C.1.
Current usage metrics show cumulative count of Article Views (full-text article views including HTML views, PDF and ePub downloads, according to the available data) and Abstracts Views on Vision4Press platform.
Data correspond to usage on the plateform after 2015. The current usage metrics is available 48-96 hours after online publication and is updated daily on week days.
Initial download of the metrics may take a while.