Open Access
Fig. 1.
Download original image
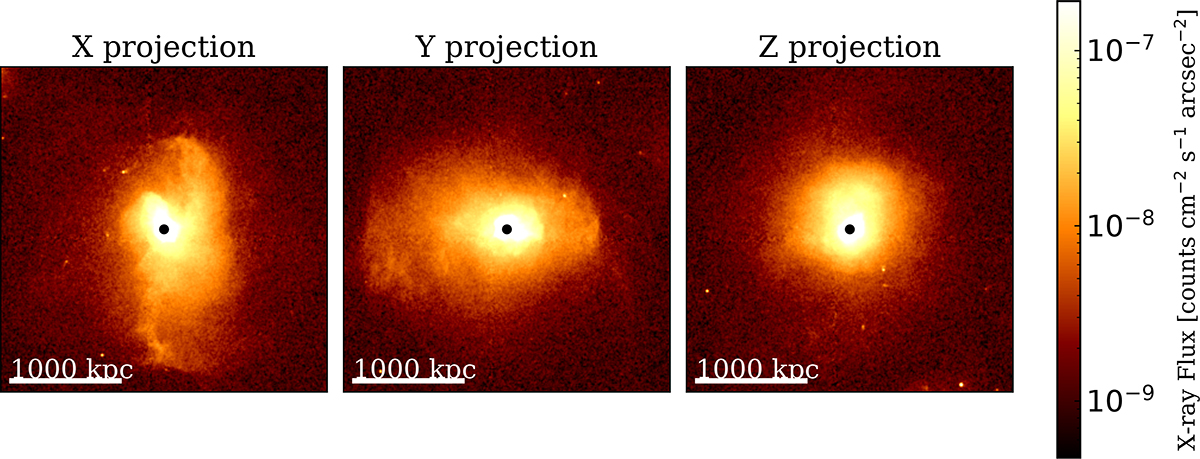
Mock X-ray images of FOF halo 0 from three projections (X, Y, and Z), centered on the group position and smoothed to a ∼10 kpc resolution. Black dots mark the centers used for cropping. A 1000 kpc scale bar is shown in each panel. The color indicates the photon counts, normalized using logarithmic scaling.
Current usage metrics show cumulative count of Article Views (full-text article views including HTML views, PDF and ePub downloads, according to the available data) and Abstracts Views on Vision4Press platform.
Data correspond to usage on the plateform after 2015. The current usage metrics is available 48-96 hours after online publication and is updated daily on week days.
Initial download of the metrics may take a while.