Fig. 12.
Download original image
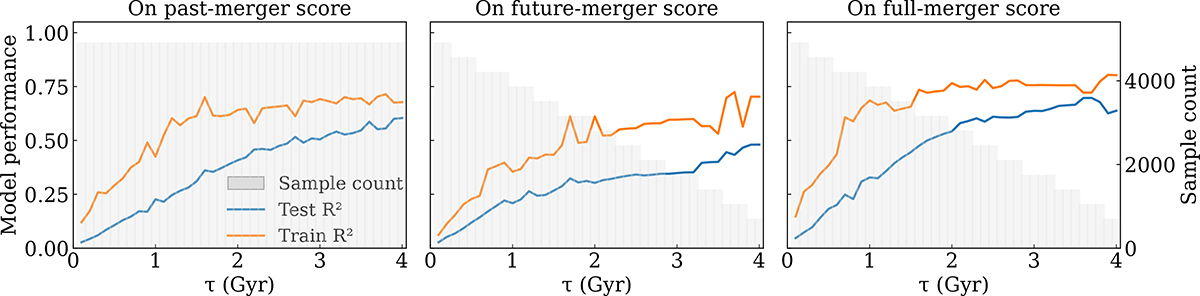
Model performance as a function of τ, evaluated using three target score definitions: past-merger (left), future-merger (middle), and full-merger (right) scores. Orange and blue curves show the training and test R2, respectively, and gray histograms indicate the sample count. This test uses the leakage-minimized split (grouping by halo ID only, so that progenitors and descendants of training halos are excluded from the test set) together with the rotation-based filtering scheme for sample selection.
Current usage metrics show cumulative count of Article Views (full-text article views including HTML views, PDF and ePub downloads, according to the available data) and Abstracts Views on Vision4Press platform.
Data correspond to usage on the plateform after 2015. The current usage metrics is available 48-96 hours after online publication and is updated daily on week days.
Initial download of the metrics may take a while.