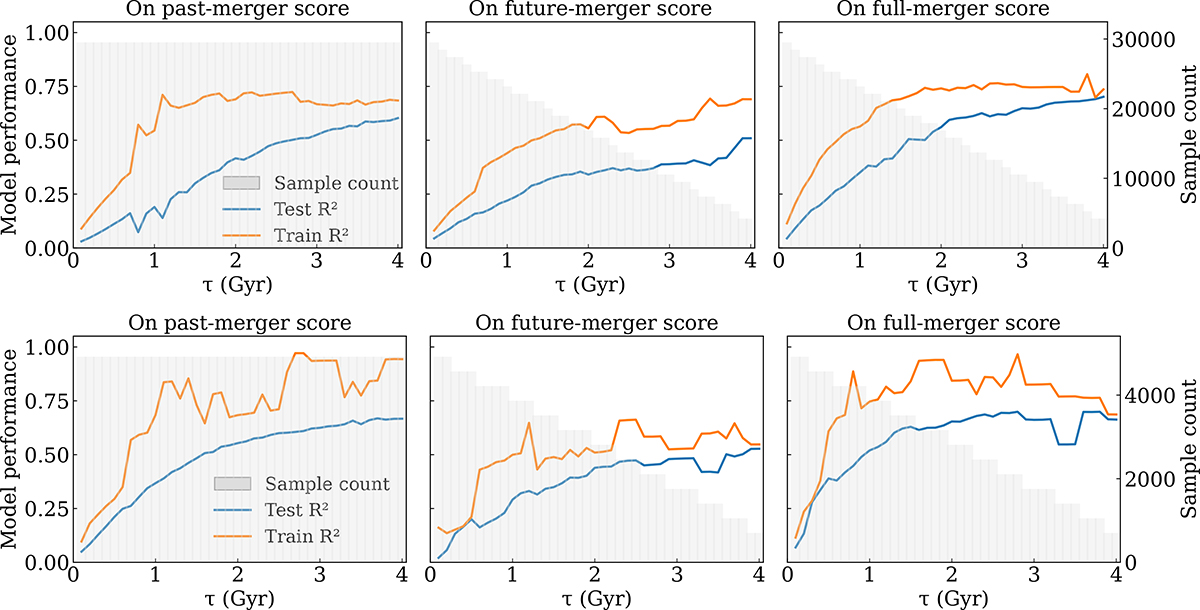
Fig. 13.
Download original image
Model performance as a function of τ, evaluated using three target-score definitions: past-merger (left), future-merger (middle), and full-merger (right) scores. Orange and blue curves show the training and test R2, respectively, and gray histograms indicate the sample count. These tests assess projection robustness. Top: Treating the three orthogonal projections of each halo as independent samples, using the leakage-minimized split (grouping by halo ID). Bottom: Following the setup in Section 3.1.1 (grouping by halo ID and snapshot number and using rotation-based filtering), the projection-rotation order is changed from [z, drop, x, drop, y, drop] to [x, drop, y, drop, z, drop]. The similar performance suggests that the model is not sensitive to the projection order, which is favorable for observational applications where only one projection is available.
Current usage metrics show cumulative count of Article Views (full-text article views including HTML views, PDF and ePub downloads, according to the available data) and Abstracts Views on Vision4Press platform.
Data correspond to usage on the plateform after 2015. The current usage metrics is available 48-96 hours after online publication and is updated daily on week days.
Initial download of the metrics may take a while.