Fig. 15.
Download original image
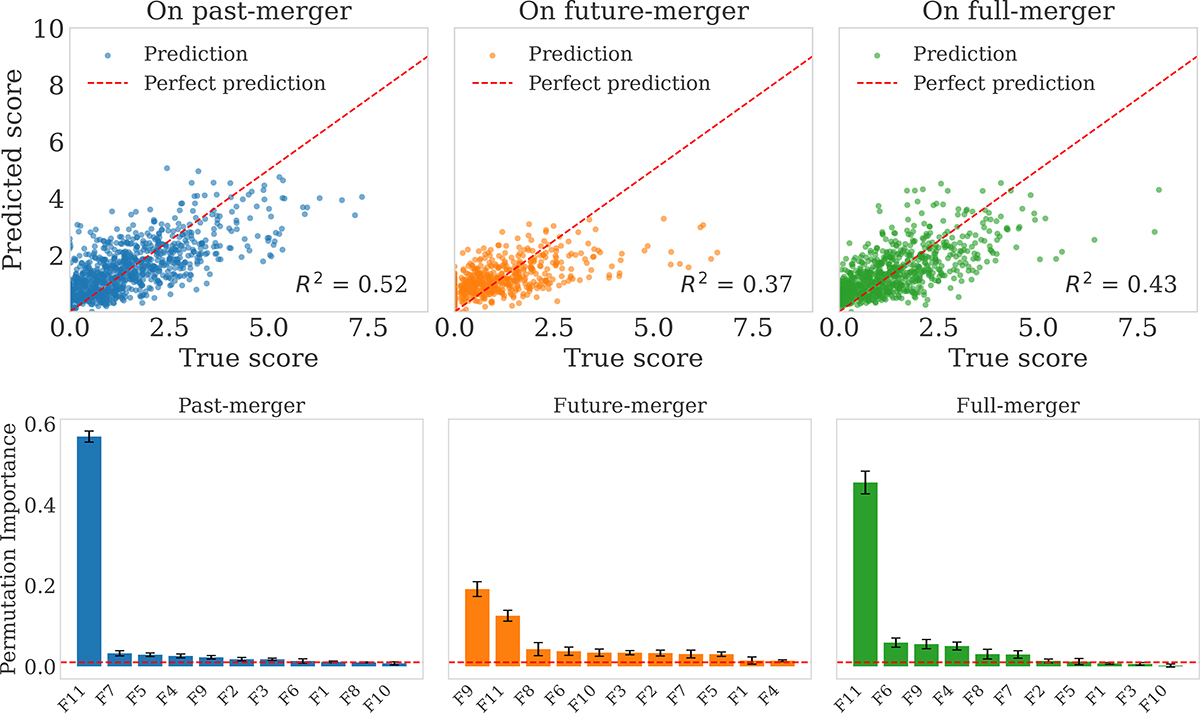
Richness-independent feature set results at selected τ values (Section 4.3): τ = 2.0 Gyr for the past- and future-merger scores and τ = 1.0 Gyr for the full-merger score. Top: Predicted versus true merger scores for past-mergers (left), future-mergers (middle), and full-merger samples (right); the red dashed line indicates perfect prediction. Bottom: Permutation feature importances for the corresponding models; bars show the mean importance, and error bars show the standard deviation over 10 permutations. The red dashed line marks the 0.01 threshold used for feature selection. Features are labeled F1–F11, ranked by importance within each model. Their definitions are as follows: F1: Δv, F2: σr, 1, F3: σr, 2, F4: σv, 1, F5: σv, 2, F6: Δbic, F7: λ2/λ1, F8: z, F9: fm, F10: σr, F11: σv.
Current usage metrics show cumulative count of Article Views (full-text article views including HTML views, PDF and ePub downloads, according to the available data) and Abstracts Views on Vision4Press platform.
Data correspond to usage on the plateform after 2015. The current usage metrics is available 48-96 hours after online publication and is updated daily on week days.
Initial download of the metrics may take a while.