Fig. 17.
Download original image
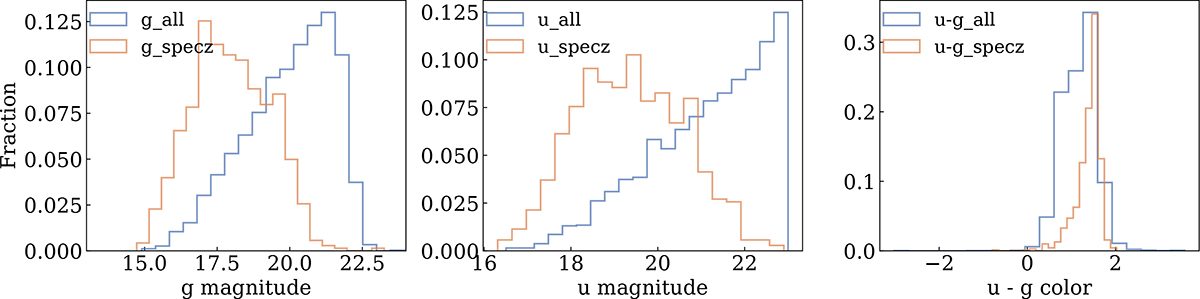
Comparison of photometric and spectroscopic galaxy member samples across the six LoVoCCS clusters used in our case study. Left: g-band magnitude distribution. Middle: u-band magnitude distribution. Right: (u − g) color distribution. The histograms are normalized by sample size to show relative fractions. Galaxies with spectroscopic redshifts (orange) tend to be brighter and redder than the full photometric sample (blue), suggesting that spectroscopic samples preferentially include red sequence galaxies.
Current usage metrics show cumulative count of Article Views (full-text article views including HTML views, PDF and ePub downloads, according to the available data) and Abstracts Views on Vision4Press platform.
Data correspond to usage on the plateform after 2015. The current usage metrics is available 48-96 hours after online publication and is updated daily on week days.
Initial download of the metrics may take a while.