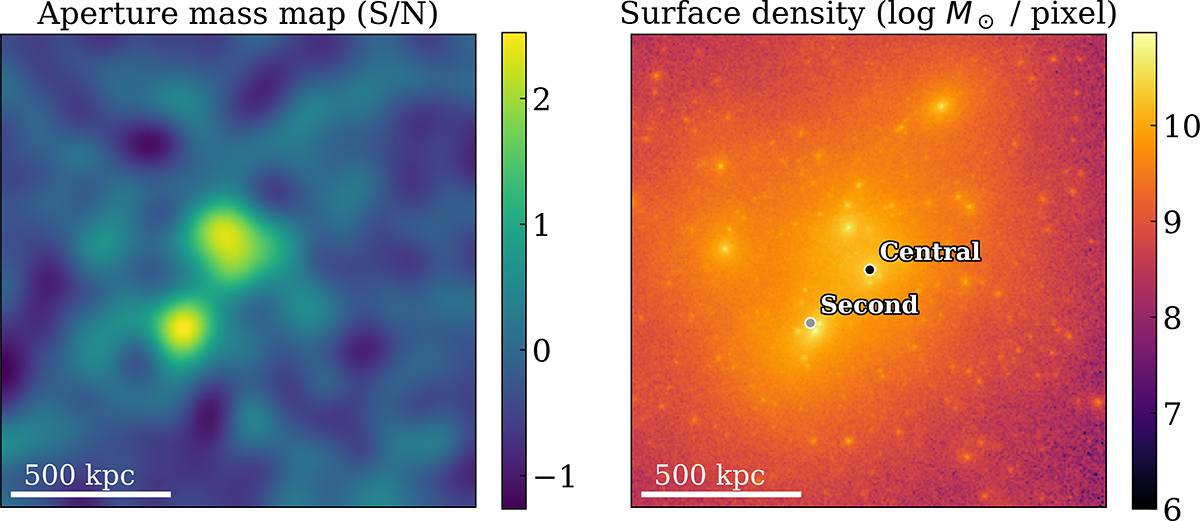
Fig. 2.
Download original image
Example mock observation from the TNG300-1 simulation. A 500 kpc scale bar is shown in each panel. Left: Simulated aperture mass map (S/N) of FOF halo 142, with R200c ∼ 750kpc, incorporating shape noise consistent with observational weak lensing data. For visualization, the maps are Gaussian-smoothed with a kernel scale of ∼60 kpc; this smoothing is applied for display purposes only. Right: Surface mass density map (dark matter + gas) in units of log M⊙/pixel. The positions of the central and the most massive satellite subhalos are marked for reference.
Current usage metrics show cumulative count of Article Views (full-text article views including HTML views, PDF and ePub downloads, according to the available data) and Abstracts Views on Vision4Press platform.
Data correspond to usage on the plateform after 2015. The current usage metrics is available 48-96 hours after online publication and is updated daily on week days.
Initial download of the metrics may take a while.