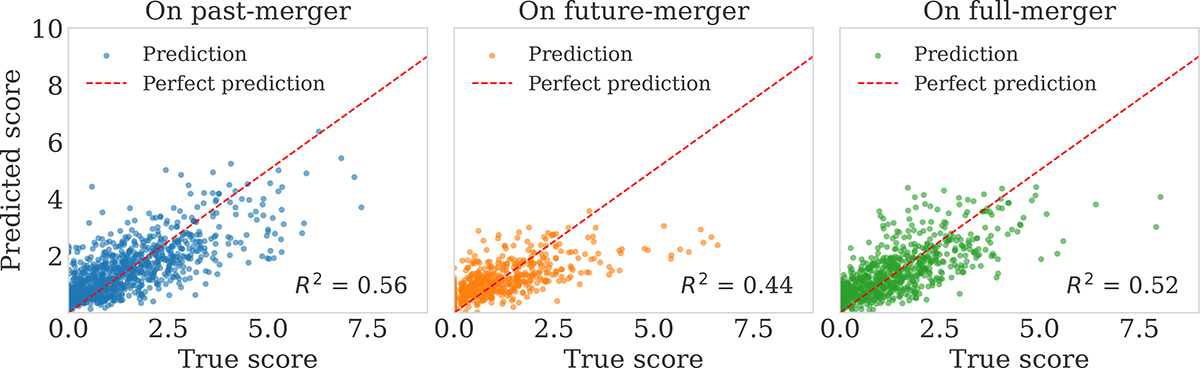
Fig. 6.
Download original image
Predicted merger scores versus true scores for three test sets: on past-merger (left), future-merger (middle), and full-merger (right) scores. The red dashed line indicates the ideal case of perfect prediction. Each panel also displays the R2 score for the corresponding test. Points are slightly transparent to indicate density. The model shows consistent predictive performance across different temporal subsets. High true scores tend to be underpredicted. This is mainly because the strongly skewed true-score distribution (Fig. 7): most halos have low scores, which dominate the training and bias the predictions toward low values.
Current usage metrics show cumulative count of Article Views (full-text article views including HTML views, PDF and ePub downloads, according to the available data) and Abstracts Views on Vision4Press platform.
Data correspond to usage on the plateform after 2015. The current usage metrics is available 48-96 hours after online publication and is updated daily on week days.
Initial download of the metrics may take a while.